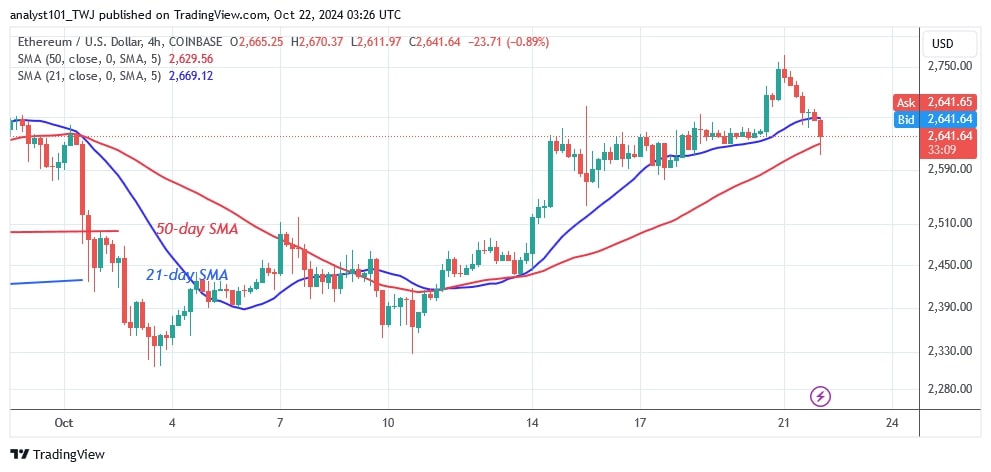
Ethereum (ETH) rose to a high of $2,758 before being pushed back. This is the fifth time Ether has tested the $2,800 resistance level.
Ethereum price long-term analysis: bullish
The largest altcoin has settled between $2,200 and $2,800. Today, Ether is dropping towards the moving average lines. The uptrend will continue if it retraces and stays above the moving average lines.
However, the urge to sell Ether will continue if the bear breaks below these lines. The altcoin will crash and regain its previous low above $2,300. At the time of writing, the altcoin is valued at $2,645.
Analysis of the Ethereum indicators
The moving average lines are horizontal due to the price movement between $2,200 and $2,800. On the 4-hour chart, the price of the cryptocurrency lies between the moving average lines, indicating that it will continue to move in a range. Doji candlesticks also influence the price movement.
Technical Indicators:
Resistance Levels – $4,000 and $4,500
Support Levels – $3.500 and $3,000
What is the next direction for Ethereum?
The 4-hour chart shows that Ether is in an upward correction and has reached a high of $2,768. Buyers tried to break through the resistance at $2,800 but failed to do so. The upward movement of the price was slowed down by the resistance at $2,800. Today, the largest altcoin has returned to its trading range after rejecting the recent high.

Disclaimer. This analysis and forecast are the personal opinions of the author. They are not a recommendation to buy or sell cryptocurrency and should not be viewed as an endorsement by CoinIdol.com. Readers should do their research before investing in funds.
Read the full article here


