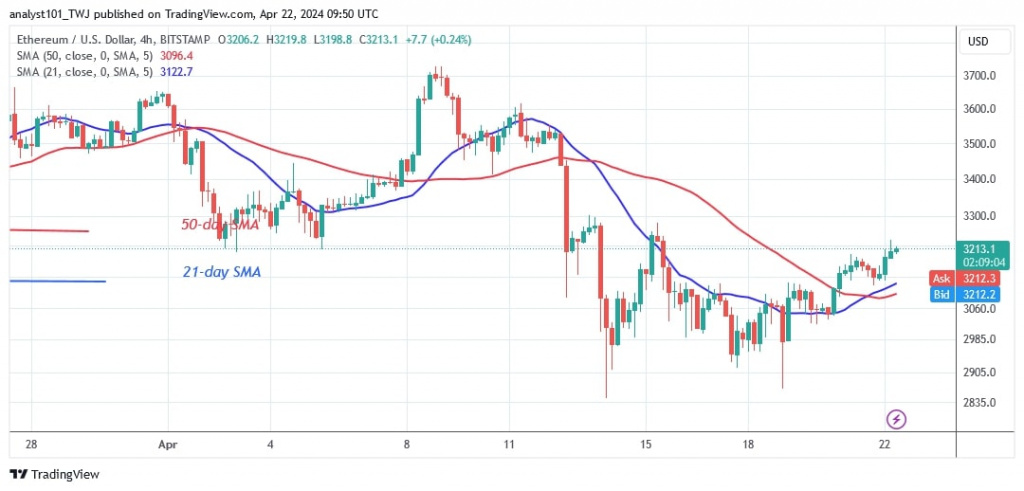
The price of Ethereum (ETH) is recovering and approaching the 21-day SMA while remaining below the moving average lines.
Long-term analysis of the Ethereum price: bearish
Since the price dip on April 13, 2024, the bulls have bought the dips and resumed consolidation above the $2,900 support but below the 21-day SMA high or the $3,200 resistance level. As Coinidol.com analysis reports, on a positive note, Ether is retesting the 21-day SMA for the first time since the dip.
The largest altcoin is capable of advancing to the high of the 50-day SMA or the high at $3,488 if it surpasses the 21-day SMA.
Nonetheless, the altcoin will continue its uptrend if the price breaks above the 50-day SMA. Ether will return to its previous high of $4,000. Meanwhile, Ethereum will continue its rise below the moving average lines if it fails to rise above the moving average lines.
Analysis of the Ethereum indicators
After the recent upward correction, the price bars on the 4-hour chart have risen back above the moving average lines. Ether is likely to rise as the price bars are above the moving average lines. The uptrend is being held back by the emergence of doji candlesticks and resistance at $3,200.
Technical indicators:
Key resistance levels – $4,000 and $4,500
Key support levels – $3,500 and $3,000
What is the next direction for Ethereum?
Ethereum continues to trade sideways after the downtrend was halted above the $2,900 support. Ether is currently facing a rejection at its high of $3,239. Doji candlesticks have halted the move from its recent peak. Ether will remain in a trading range for the next few days.

Disclaimer. This analysis and forecast are the personal opinions of the author and are not a recommendation to buy or sell cryptocurrency and should not be viewed as an endorsement by CoinIdol.com. Readers should do their research before investing in funds.
Read the full article here

