Ethereum’s recent rejection at the key resistance region of the 100-day MA level suggests a false breakout and a potential short-term correction.
However, a break above this threshold could trigger a bullish surge toward $3K. The price is expected to consolidate, with $2.4K as a critical support level.
Technical Analysis
By Shayan
The Daily Chart
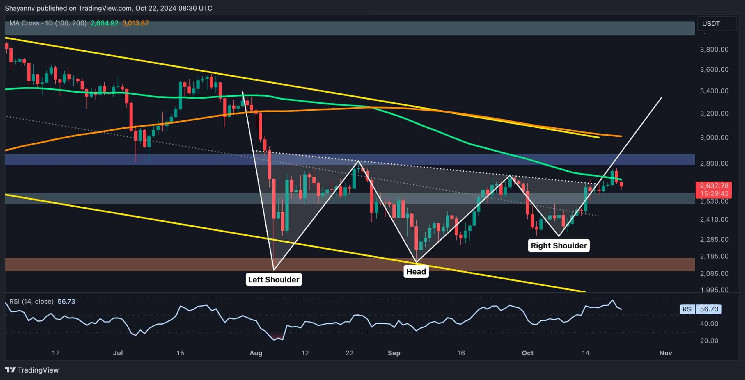
Ethereum has recently seen a notable increase in demand and bullish momentum, causing the asset to test and slightly breach the decisive resistance region formed by the 100-day moving average at $2.7K and the inverted head and shoulders neckline at $2.6K. Despite this brief breach, ETH quickly faced rejection due to significant supply at this level, causing the price to plummet below the 100-day MA.
This false breakout hints at a bull trap, signalling a potential period of descending consolidation correction in the short term. Ethereum is trading between the 100-day MA and the $2.5K support region, with a breakout above this resistance likely to signal a sustained bullish trend.
The 4-Hour Chart
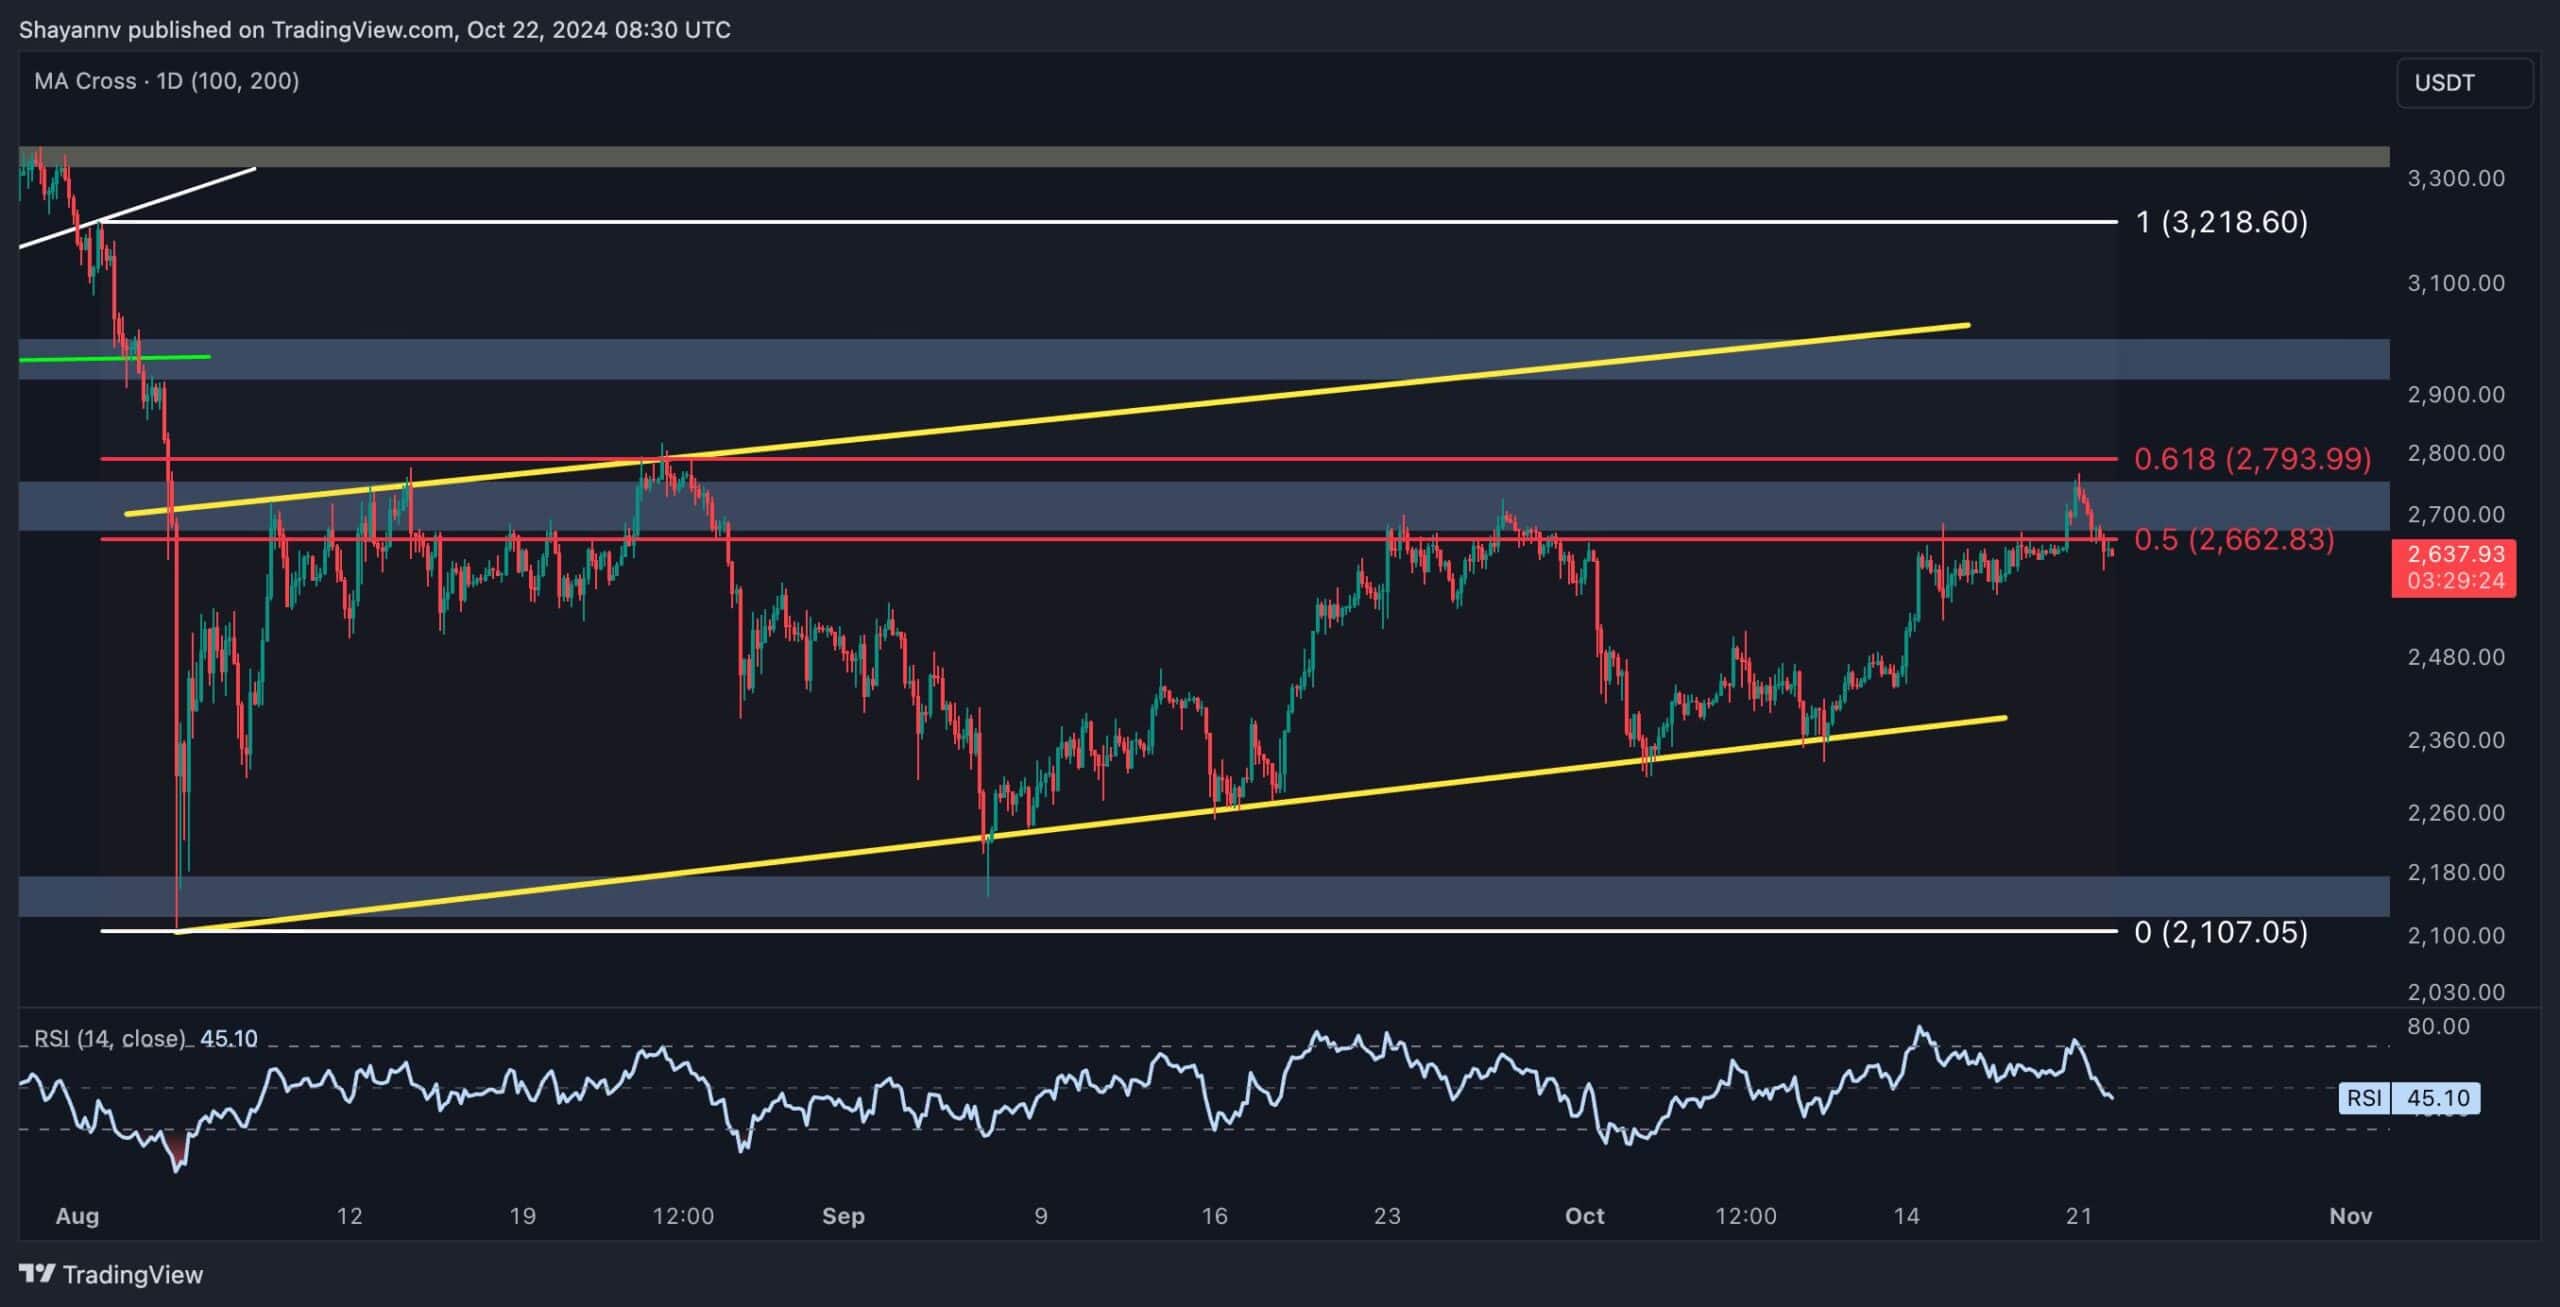
On the 4-hour chart, Ethereum surged toward the critical resistance zone bounded by the 0.5 ($2.6K) and 0.618 ($2.7K) Fibonacci retracement levels, representing a significant barrier for buyers. A breakout above this range could lead to massive short liquidations and a further price rally. However, the recent price action indicates intense selling pressure near this area, resulting in a rejection and a halt in bullish momentum.
If this selling pressure persists, Ethereum will likely enter a period of mid-term consolidation correction, targeting the lower boundary of the flag pattern around the $2.4K threshold. Conversely, if buying pressure resurges and the price breaks through the $2.7K resistance, the next target will likely be the $3K substantial resistance, which also coincides with the 200-day moving average.

Onchain Analysis
By Shayan
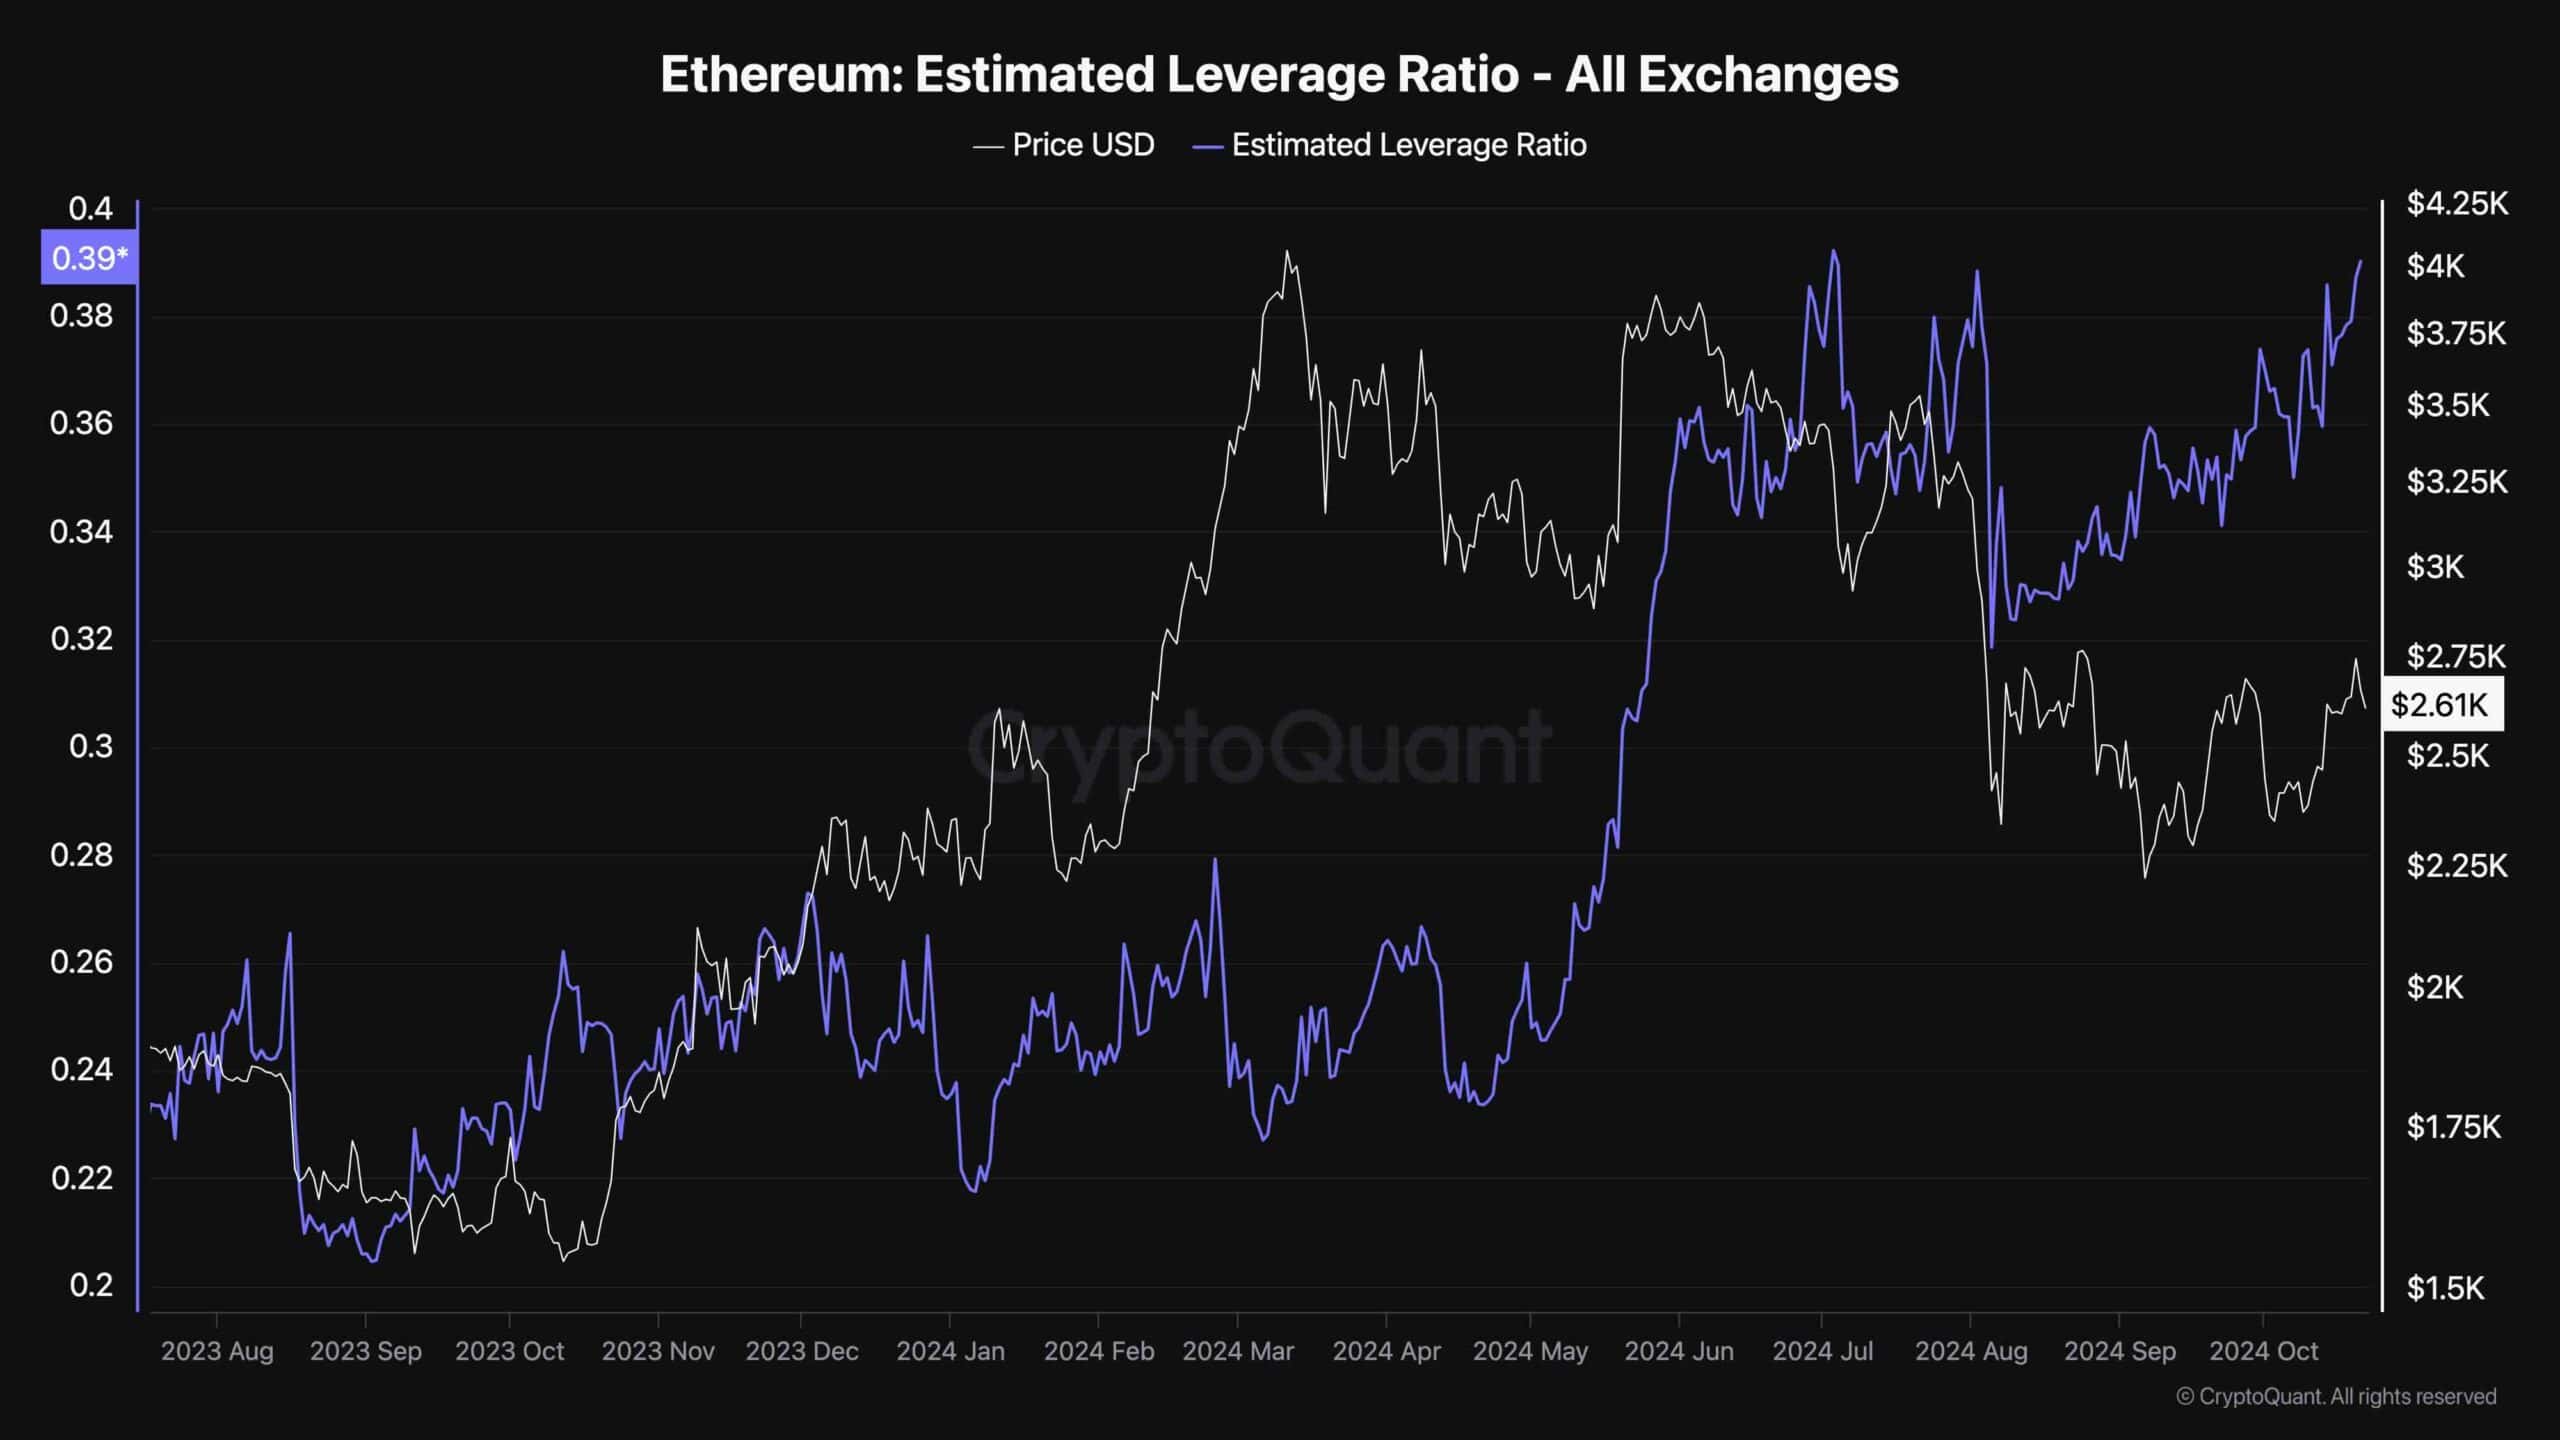
The Estimated Leverage Ratio is an essential metric for gauging the risk participants in the futures market are willing to take by using leverage. A rising ELR typically signals an increase in leveraged positions, which can amplify market moves in either direction.
The metric has increased over the last few months, coinciding with an overall price downtrend. This suggests that more traders are opening high-leverage short positions, betting on further price declines for Ethereum. The market appears bearish on ETH’s upcoming prospects, with many expecting further downside.
With leverage at concerning levels, the futures market is now considered overheated. This leaves Ethereum vulnerable to a potential short-squeeze event.
In such a scenario, if ETH rises unexpectedly, traders with short positions could be forced to cover their positions by buying back ETH, creating an impulsive price spike. The 100-day moving average at $2.7K is a key resistance level. A breakout above this level would likely lead to massive short liquidations, increasing ETH’s price.
Read the full article here


