A cryptocurrency trading expert is warning that Bitcoin (BTC) might be preparing for a major crash following a deceptive rally in which the asset failed to reclaim its previous record high.
This outlook comes as Bitcoin continues to consolidate below the $70,000 resistance.
Alan Santana observed that Bitcoin is flashing warning signs after showing a rare pattern of five consecutive red days, a movement that hasn’t occurred since May 2023, as he noted in a TradingView post on November 3.
While Santana acknowledged that Bitcoin has faced significant downside risk for a while, the current chart pattern shows a “rounded top” or “inverted cup,” often interpreted as a bearish reversal indicator.
Bitcoin price levels to watch
In this case, Bitcoin is approaching a critical support level near $69,000. Santana argued that a breakdown below this level would validate the bearish structure, potentially setting Bitcoin toward much lower levels, with a possible test of $40,000.
On the other hand, he noted there remains room for Bitcoin to recover but expressed caution. The double-top pattern near $73,800, without reaching a new all-time high, indicates weakness.
This movement and broader market weakness among altcoins led Santana to conclude that Bitcoin might be setting up for its “biggest crash in years.”
“Two instances earlier this year produced 5 days red. In August to complete the major crash and also in June halfway through a bearish move, this has never happened right after a major high/peak. This can signal that a sudden surprise reversal will happen and we won’t see any more red and Bitcoin will grow rather than crash. Or, we will witness the biggest crash in years. The latter is the most likely scenario,” he said.
In the meantime, he called on investors to monitor Bitcoin’s weekly close. A close below the neckline support above $68,000 could trigger a significant decline.
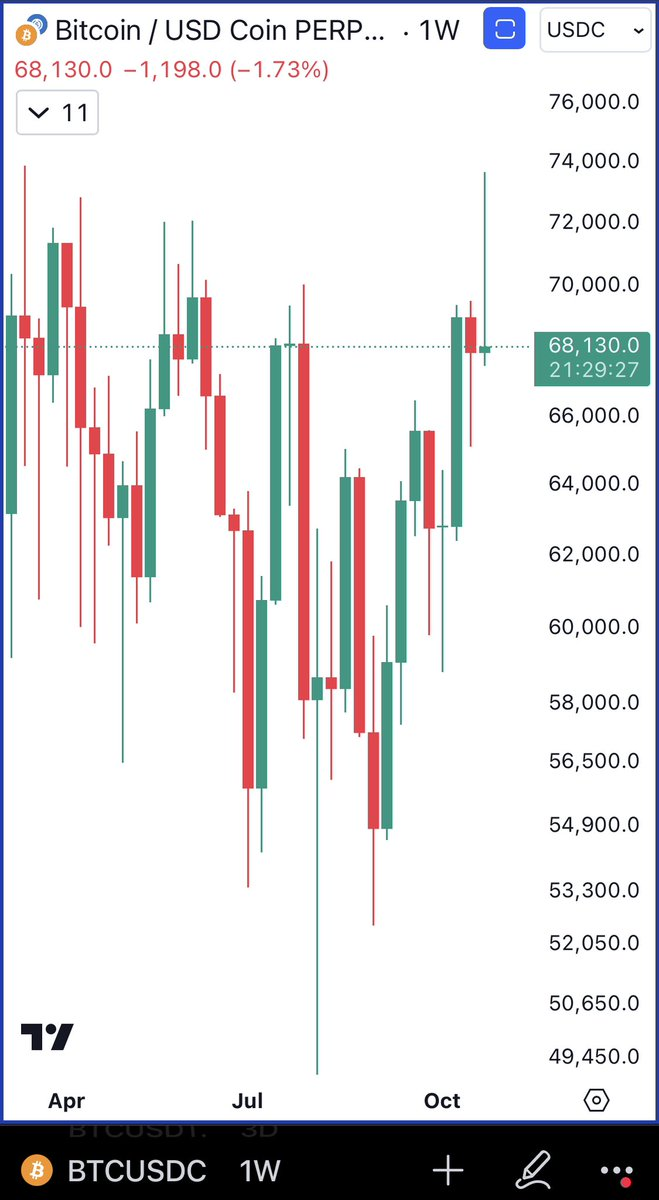
Crypto analyst Ali Martinez’s analysis of the Bitcoin weekly chart suggested a bearish sentiment, further supporting this perspective.
In an X post on November 3, he noted that Bitcoin’s weekly candle shows signs of rejection at higher levels, with a significant wick at the top. This hints that upward momentum is weakening, likely invalidating any bullish movement.

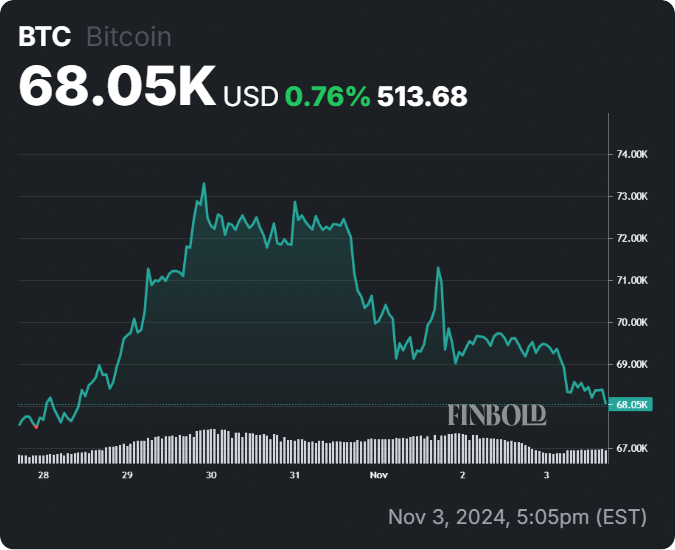
These concerns arose as the crypto market had anticipated further gains for Bitcoin following one of its best monthly closes in October. The close above $70,000 led to high anticipation that Bitcoin might target the $100,000 record high. However, the failure to hold $70,000 suggests investors may have to wait longer for a new record high.
Moving into the new week, there is some optimism. Major catalysts for Bitcoin potentially come into play, with the presidential election high on the list. Market players believe a Donald Trump win could be bullish for Bitcoin, given his support for the crypto sector.
Bitcoin price analysis
Bitcoin was trading at $67,979 at press time, having declined by almost 2% in the past 24 hours. The asset has made modest gains of about 0.7% on the weekly chart.

Despite Bitcoin’s short-term correction, other technical indicators suggest it might still have possible upward momentum in both the short and long term.
Specifically, the asset is trading above the 50-day and 200-day moving averages, while the Relative Strength Indicator shows the cryptocurrency is demonstrating stability.
Read the full article here


