


Hedera (HBAR) is up more than 4% in the last 24 hours but remains down nearly 7% over the past week, continuing to struggle below the $0.19 mark. Despite the short-term rebound, technical signals remain mixed, with the BBTrend pointing to rising bearish momentum and EMA lines still favoring a downward bias.
However, a sharp recovery in RSI suggests that buying pressure is beginning to return, hinting at a possible shift in market sentiment. With price action nearing key resistance and support levels, HBAR is entering a critical zone that could determine its next major move.
Hedera Slides as BBTrend Turns Deeply Negative
Hedera is showing signs of weakening momentum as its BBTrend has sharply declined to -12.41, down from -0.83 just two days ago.
Earlier today, the indicator hit a low of -13.43 before slightly recovering, underscoring a potential intensification in bearish pressure.
This rapid shift suggests that HBAR is entering a stronger downtrend phase, with sellers increasingly dominating recent price action.
BBTrend, short for Bollinger Band Trend, is a technical indicator that measures the strength and direction of price movements based on the width and slope of the Bollinger Bands.
When the BBTrend turns deeply negative, it typically signals that the price is trending downward with increasing volatility. In the case of HBAR, the current BBTrend reading of -12.41 indicates that bearish momentum is gaining traction.
If this trend persists, it may lead to further price declines or at the very least, prolonged consolidation near lower support levels.
HBAR Momentum Recovers as RSI Rebounds from Oversold Zone
Hedera is showing a notable shift in momentum as its Relative Strength Index (RSI) has climbed to 50.39, up significantly from 26.6 just two days ago.
This sharp rise suggests that buying interest has picked up, potentially marking the end of an oversold phase.
The recovery toward the neutral zone indicates a possible trend reversal or at least a pause in the recent selling pressure.

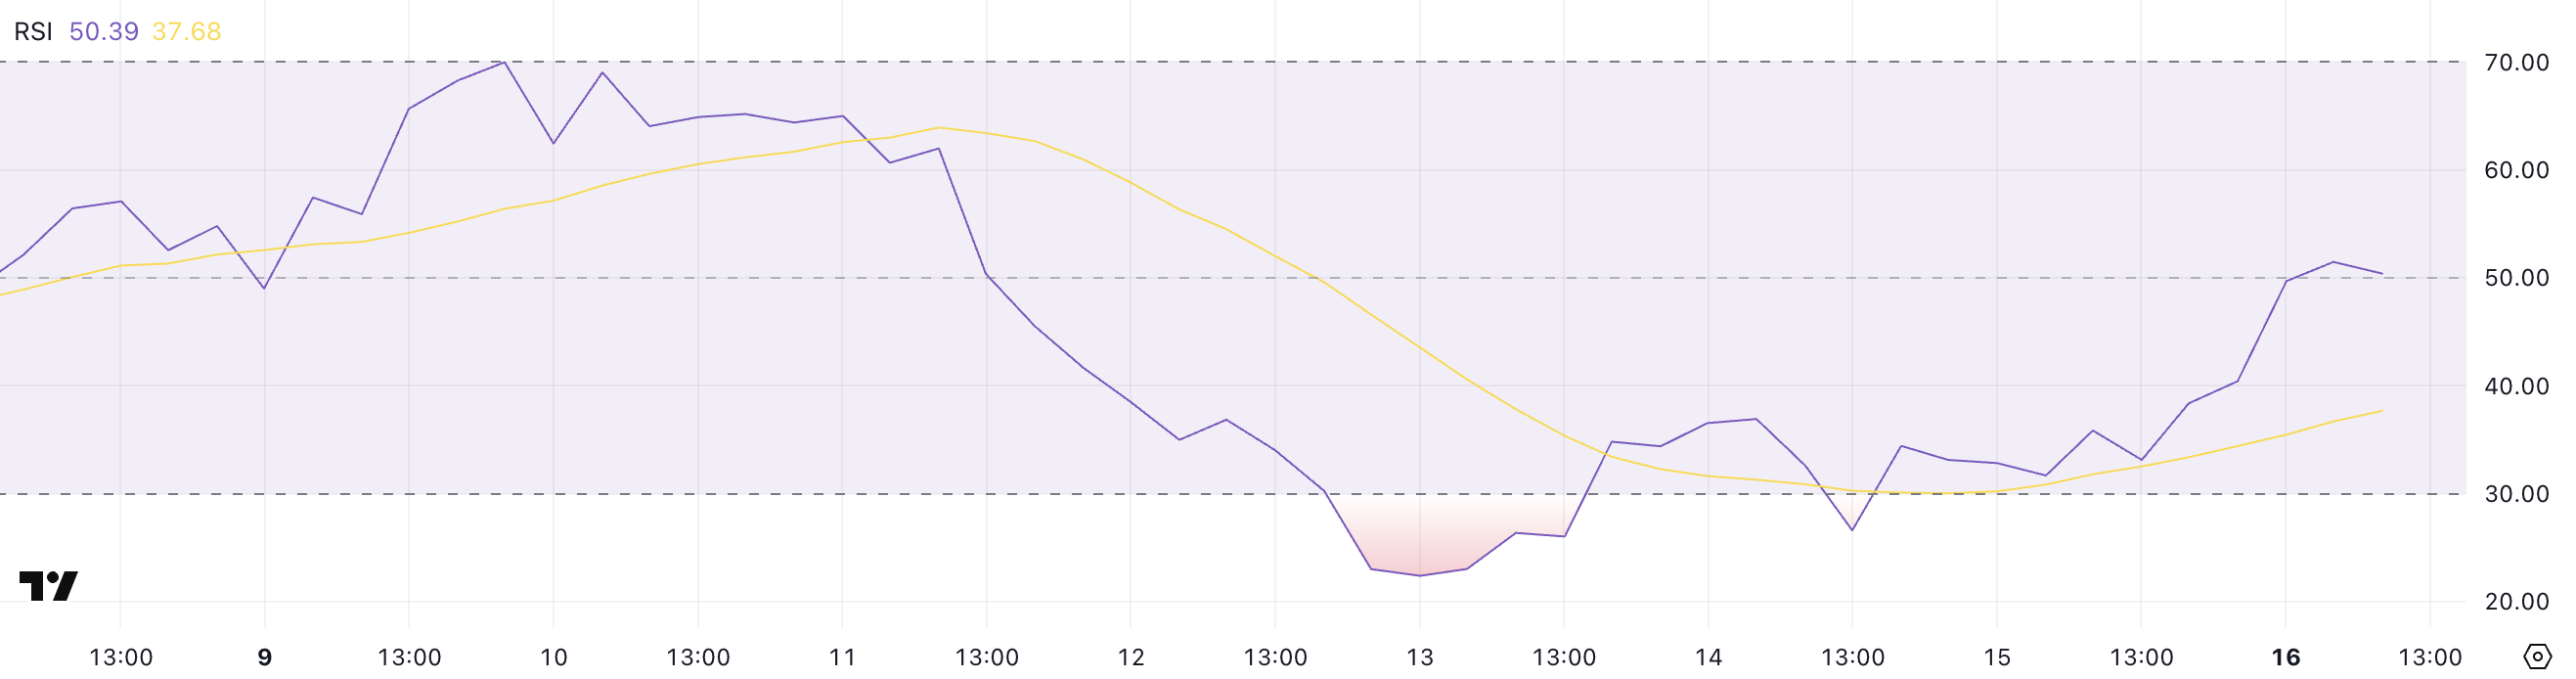
RSI is a momentum oscillator that measures the speed and change of price movements on a scale from 0 to 100. Readings below 30 generally indicate that an asset is oversold, while readings above 70 suggest it may be overbought.
With HBAR’s RSI now hovering around 50, the token is neither overbought nor oversold, signaling balance between buyers and sellers.
This level could act as a pivot point—either paving the way for a bullish breakout if upward momentum continues, or triggering renewed selling if resistance holds.
Hedera Faces Make-or-Break Moment Between $0.160 and $0.155
Hedera price remains under a bearish technical structure as its short-term Exponential Moving Averages (EMAs) continue to sit below the long-term ones.
This configuration typically signals downward pressure, but price action is now approaching a key resistance level at $0.160.

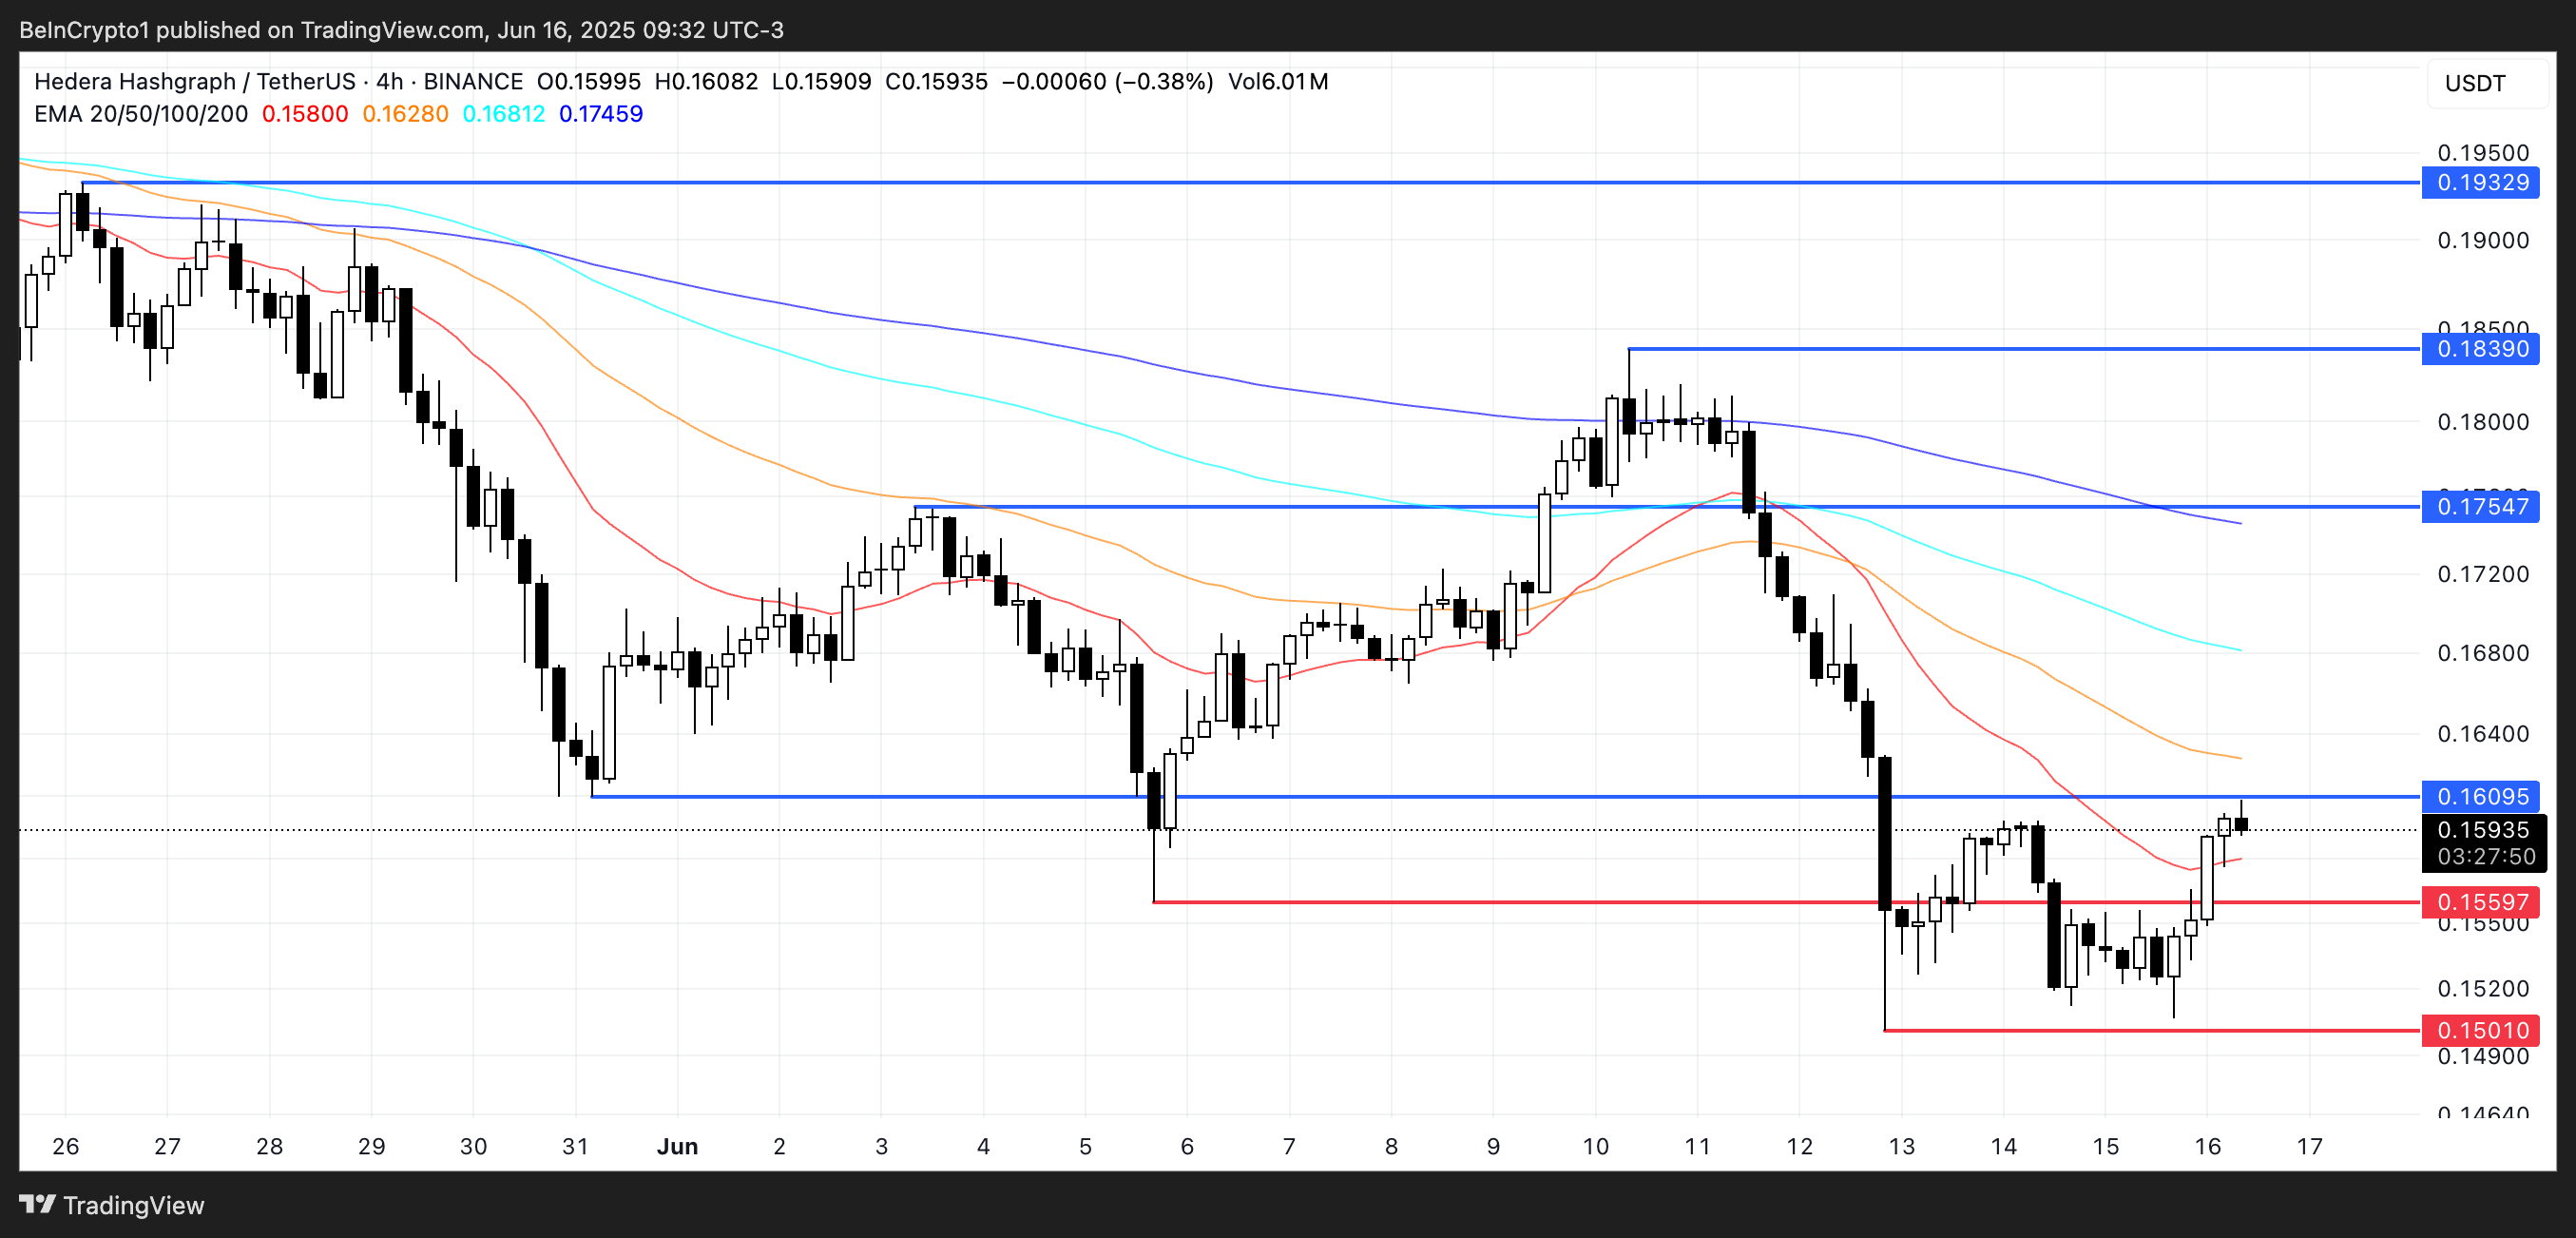
A confirmed breakout above this zone could open the door for a move toward $0.175, with further upside potential to $0.183 and even $0.193 if bullish momentum strengthens.
However, if HBAR fails to sustain upward pressure and gets rejected near resistance, it may retest the immediate support at $0.155. A breakdown below this level could lead to a slide toward $0.150, reinforcing the existing bearish structure.
Disclaimer
In line with the Trust Project guidelines, this price analysis article is for informational purposes only and should not be considered financial or investment advice. BeInCrypto is committed to accurate, unbiased reporting, but market conditions are subject to change without notice. Always conduct your own research and consult with a professional before making any financial decisions. Please note that our Terms and Conditions, Privacy Policy, and Disclaimers have been updated.
Read the full article here


