Cardano (ADA) price is facing sustained downward pressure, with multiple technical indicators pointing to a strong bearish trend. The ADX suggests that this trend has intensified recently, confirming that sellers hold control of the market.
Both the Ichimoku Cloud and EMA lines reinforce this outlook, with ADA trading below key resistance levels and the recent formation of a death cross signaling ongoing weakness.
ADA Current Trend Is Strong
Cardano’s (ADA) ADX has climbed to 36.76, a significant rise from around 17 just days ago. This increase signals that the strength of ADA’s current trend has intensified.
The ADX, or Average Directional Index, gauges trend strength rather than direction, with values above 25 typically indicating a strong trend. This higher ADX reading confirms that ADA is in a firm downtrend, highlighting sustained selling pressure.
Read more: Who Is Charles Hoskinson, the Founder of Cardano?
ADA ADX. Source: TradingView
Currently, ADA’s price is in a clear downtrend, and the ADX level at 36.76 reinforces the strength of this bearish momentum. Such a high ADX level suggests that the downward trend is gaining strength.
This may indicate that, in the short term, ADA could continue to face selling pressure, and a reversal is less likely until the ADX begins to decline.
Cardano Ichimoku Cloud Paints a Bearish Scenario
The Ichimoku Cloud chart for Cardano (ADA) currently shows a bearish outlook, with the price trading below the cloud. This positioning typically signals a downward trend, as the price struggles to gain traction above key resistance levels.
The cloud itself is red, indicating potential resistance for any attempted upward moves. The Tenkan-sen (conversion line) and Kijun-sen (baseline) are also positioned above the price, reinforcing the bearish sentiment and showing that sellers maintain control.
ADA Ichimoku Cloud. Source: TradingView
Additionally, the EMA lines in the chart confirm the bearish trend, with short-term EMAs below the long-term ones. This alignment suggests that ADA is likely to face continued downward pressure in the near term unless a reversal breaks through the cloud.
If the price manages to push above the cloud, it could signal a potential trend change; however, with the current setup, the likelihood leans more toward consolidation or further decline.
ADA Price Prediction: Can ADA Recover From Recent Corrections?
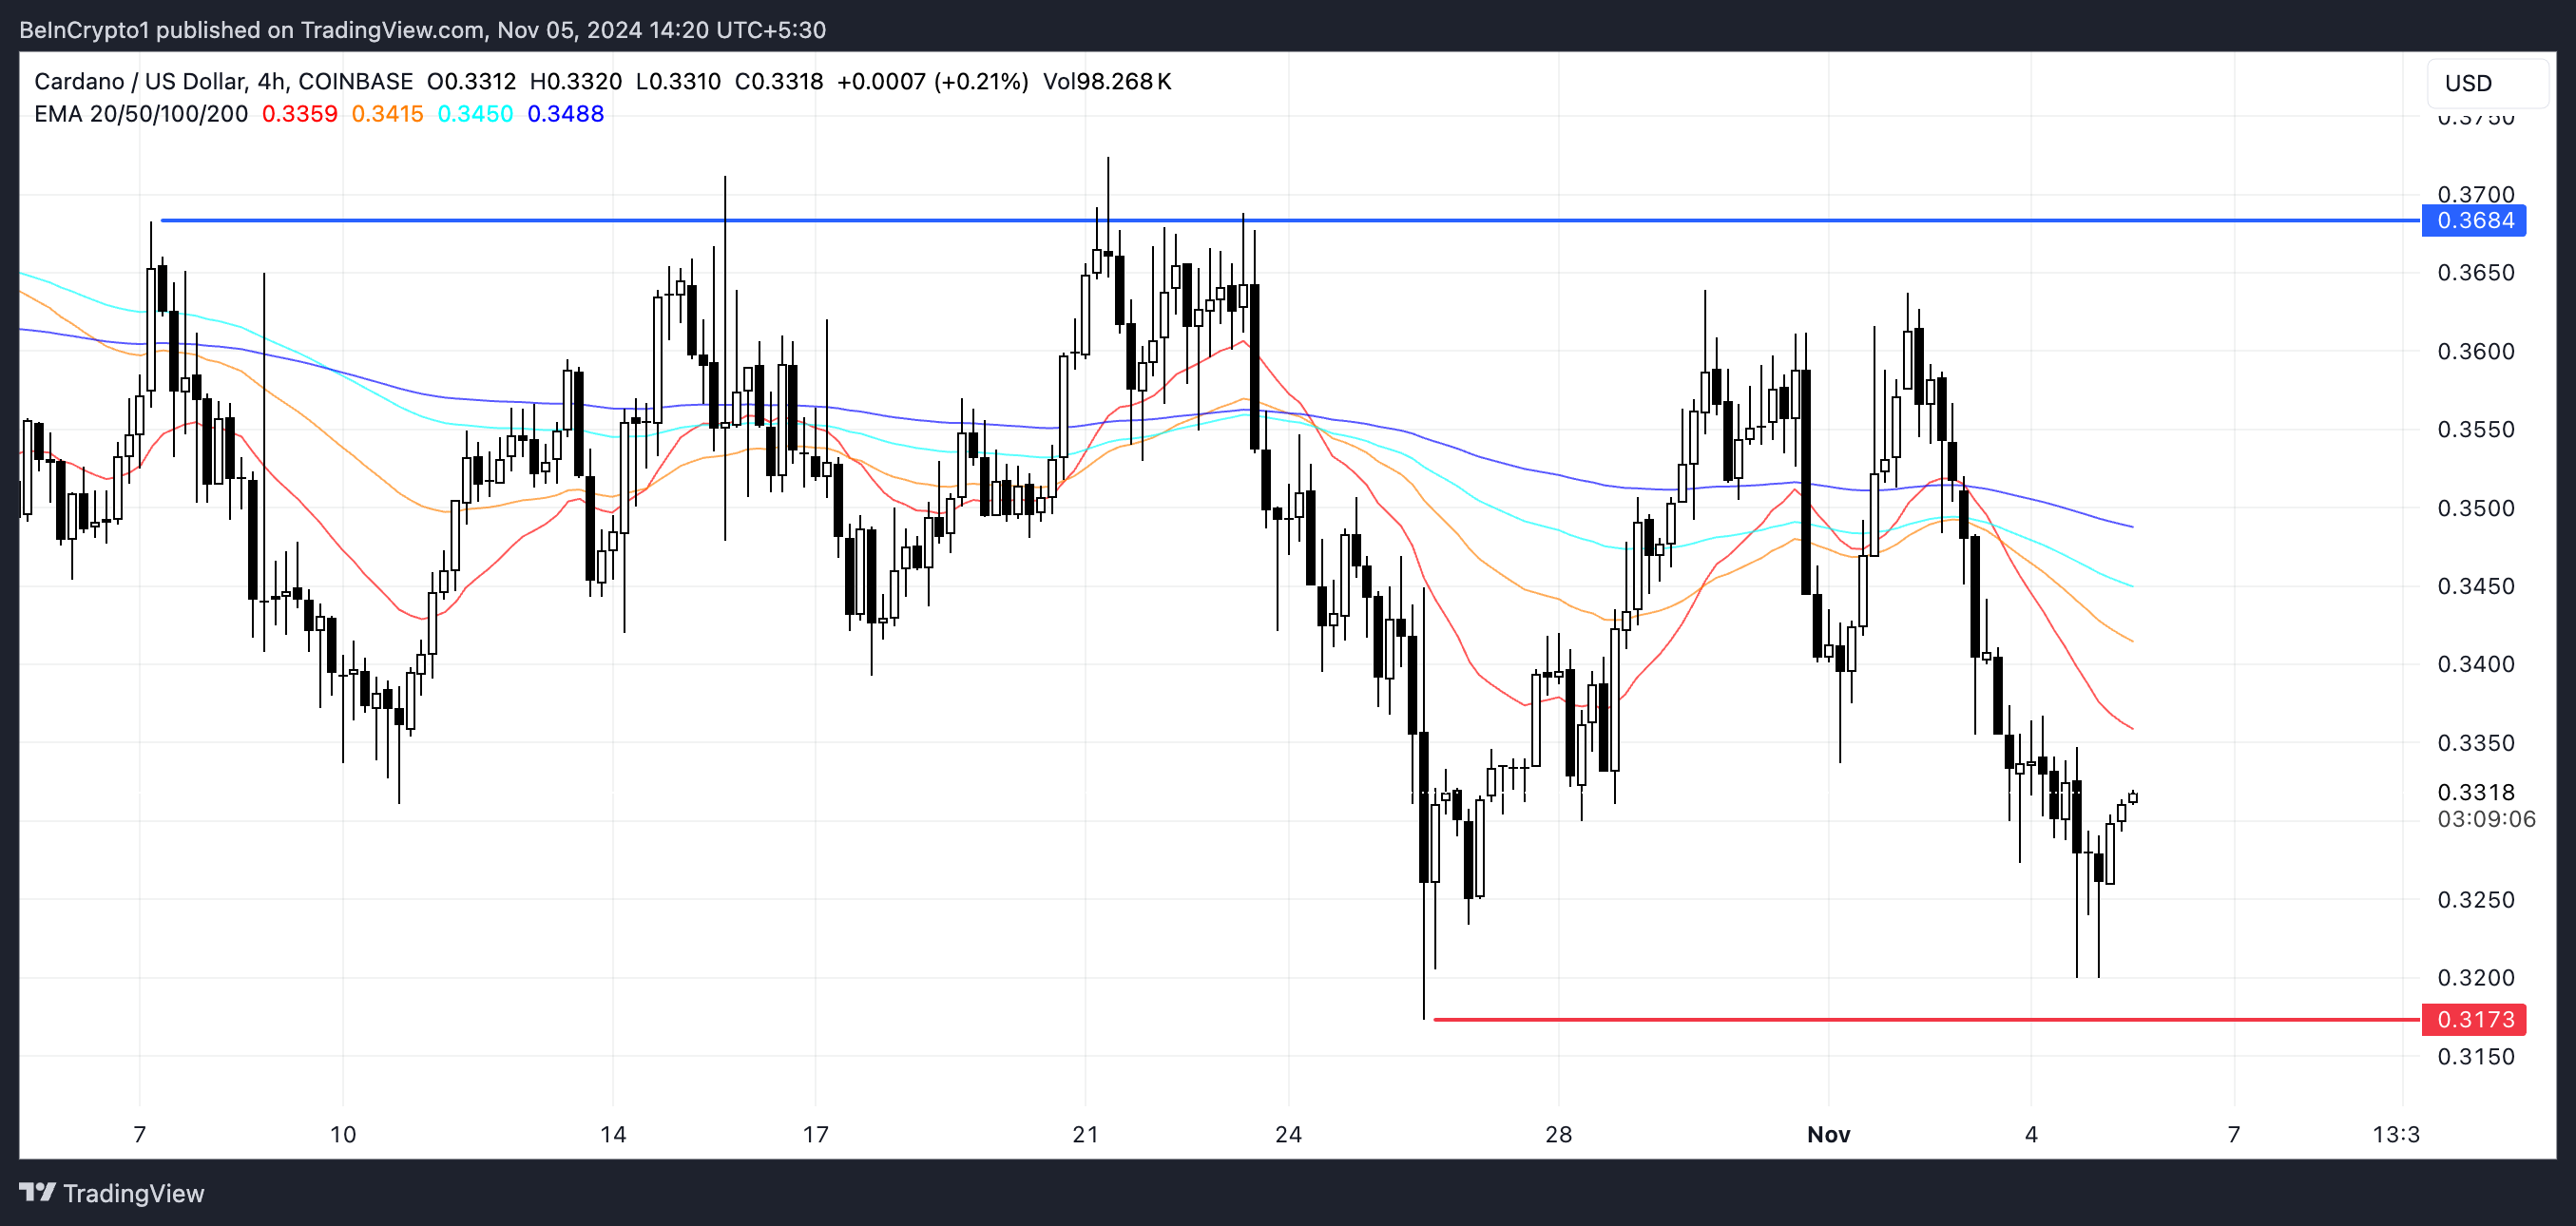
Cardano’s (ADA) EMA lines are showing a strong bearish configuration, with all EMAs positioned above the current price and short-term EMAs sitting below the long-term ones.
This alignment, combined with a recent death cross, indicates sustained downward pressure and suggests that sellers are firmly in control.
Read more: How To Buy Cardano (ADA) and Everything You Need To Know

ADA EMA Lines and Support and Resistance. Source: TradingView
If this downtrend persists, ADA price may soon test its support level at $0.31, and if the bearish momentum remains strong, it may fall further.
However, if the selling pressure weakens and an uptrend emerges, ADA could aim to reach its next major resistance at $0.36. That would mean a potential 9% upside. The direction of ADA’s next move will largely depend on whether the current bearish sentiment shifts in favor of buyers.
Read the full article here


