


Key takeaways:
-
XRP is eyeing a 75% breakout from a symmetrical triangle pattern.
-
Whale flows flipped positive in May, signaling renewed accumulation.
-
The $2.34–$2.40 range is a key resistance zone in the short term.
XRP (XRP) has risen by around 6.50% in the past 24 hours to reach $2.20 on June 28, its gains driven by the news of Ripple dropping its cross-appeal against the US Securities and Exchange Commission (SEC).
The gains are part of a broader consolidation cycle after XRP’s 575% price boom since November.
Can XRP’s price go higher from the current levels? Let’s examine.
XRP symmetrical triangle hints at ~75% rally
XRP has formed a textbook symmetrical triangle pattern since topping out near $3.40 in February. This structure, marked by converging trendlines, typically signals a continuation move after a strong prior trend—in this case, bullish.
As of June 28, XRP was testing the triangle’s upper trendline for a potential breakout. The 50-day exponential moving average (50-day EMA; the red wave) near $2.20 is acting as additional resistance.

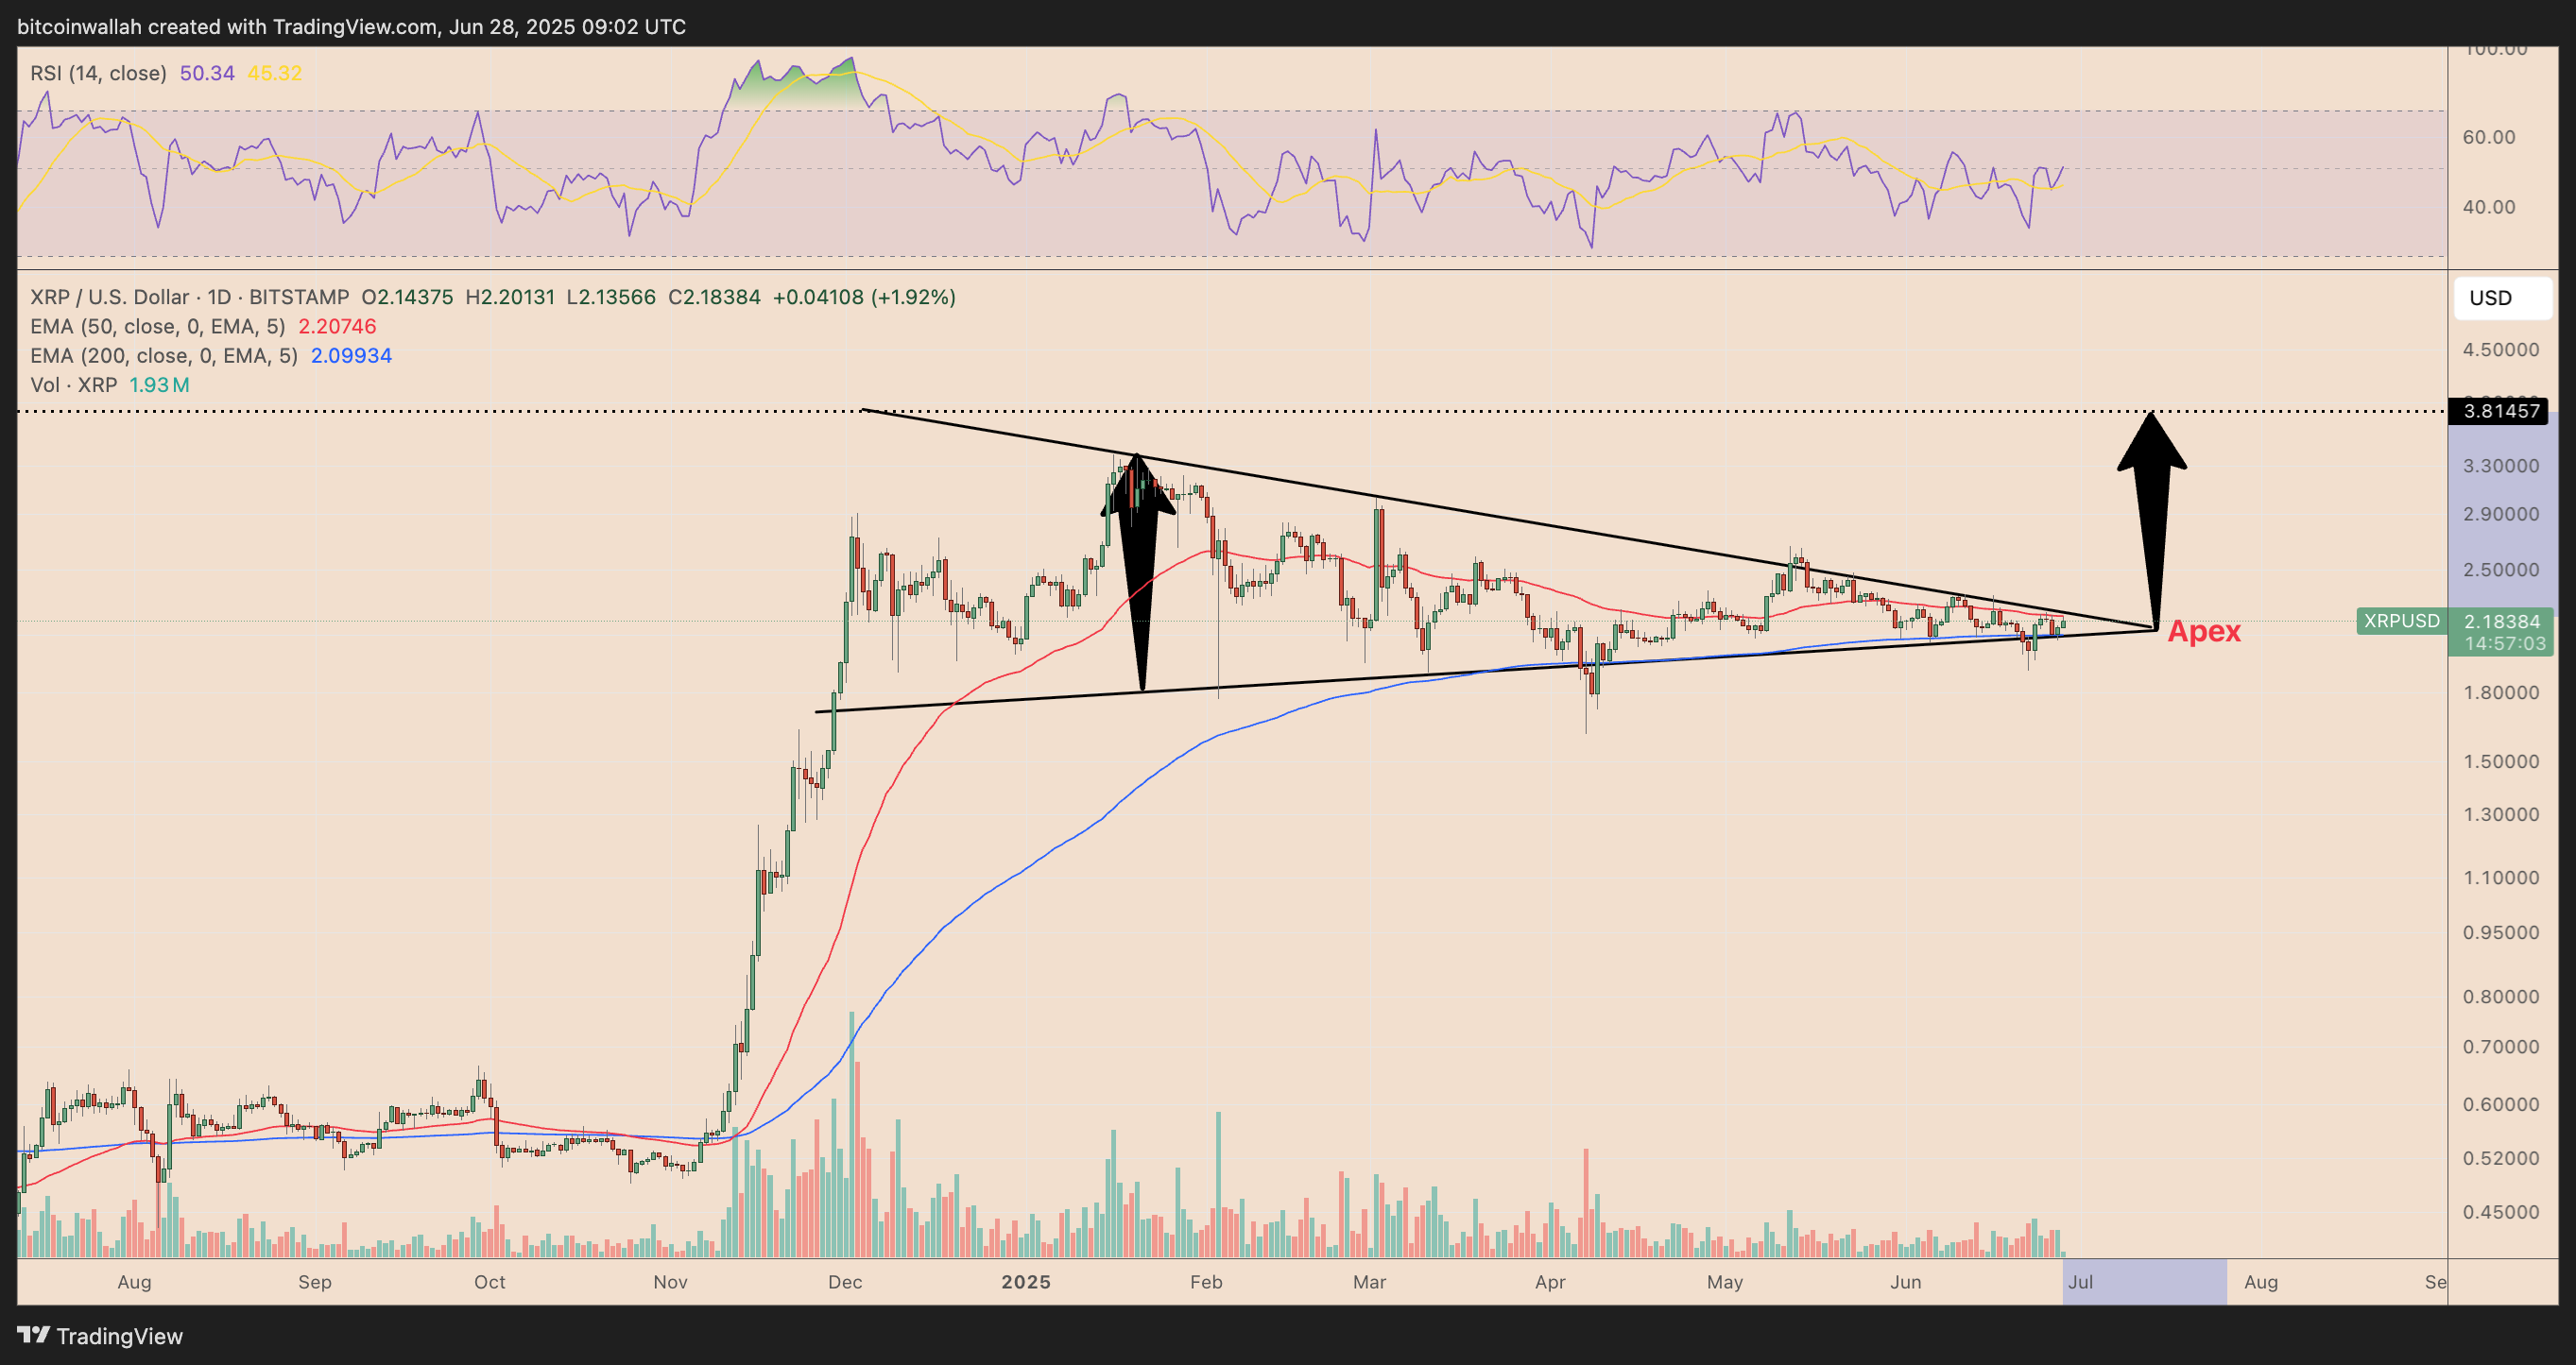
Breaking above the resistance confluence (or apex) could send the price rallying toward the triangle’s upside target of around $3.81, up about 75% from the current price levels, by July.
XRP whale accumulation adds fuel to breakout thesis
The technical setup aligns with growing signs of smart money accumulation.
XRP’s 90-day moving average whale flows flipped positive in early May, ending a prolonged distribution that stretched from January through April, according to CryptoQuant.

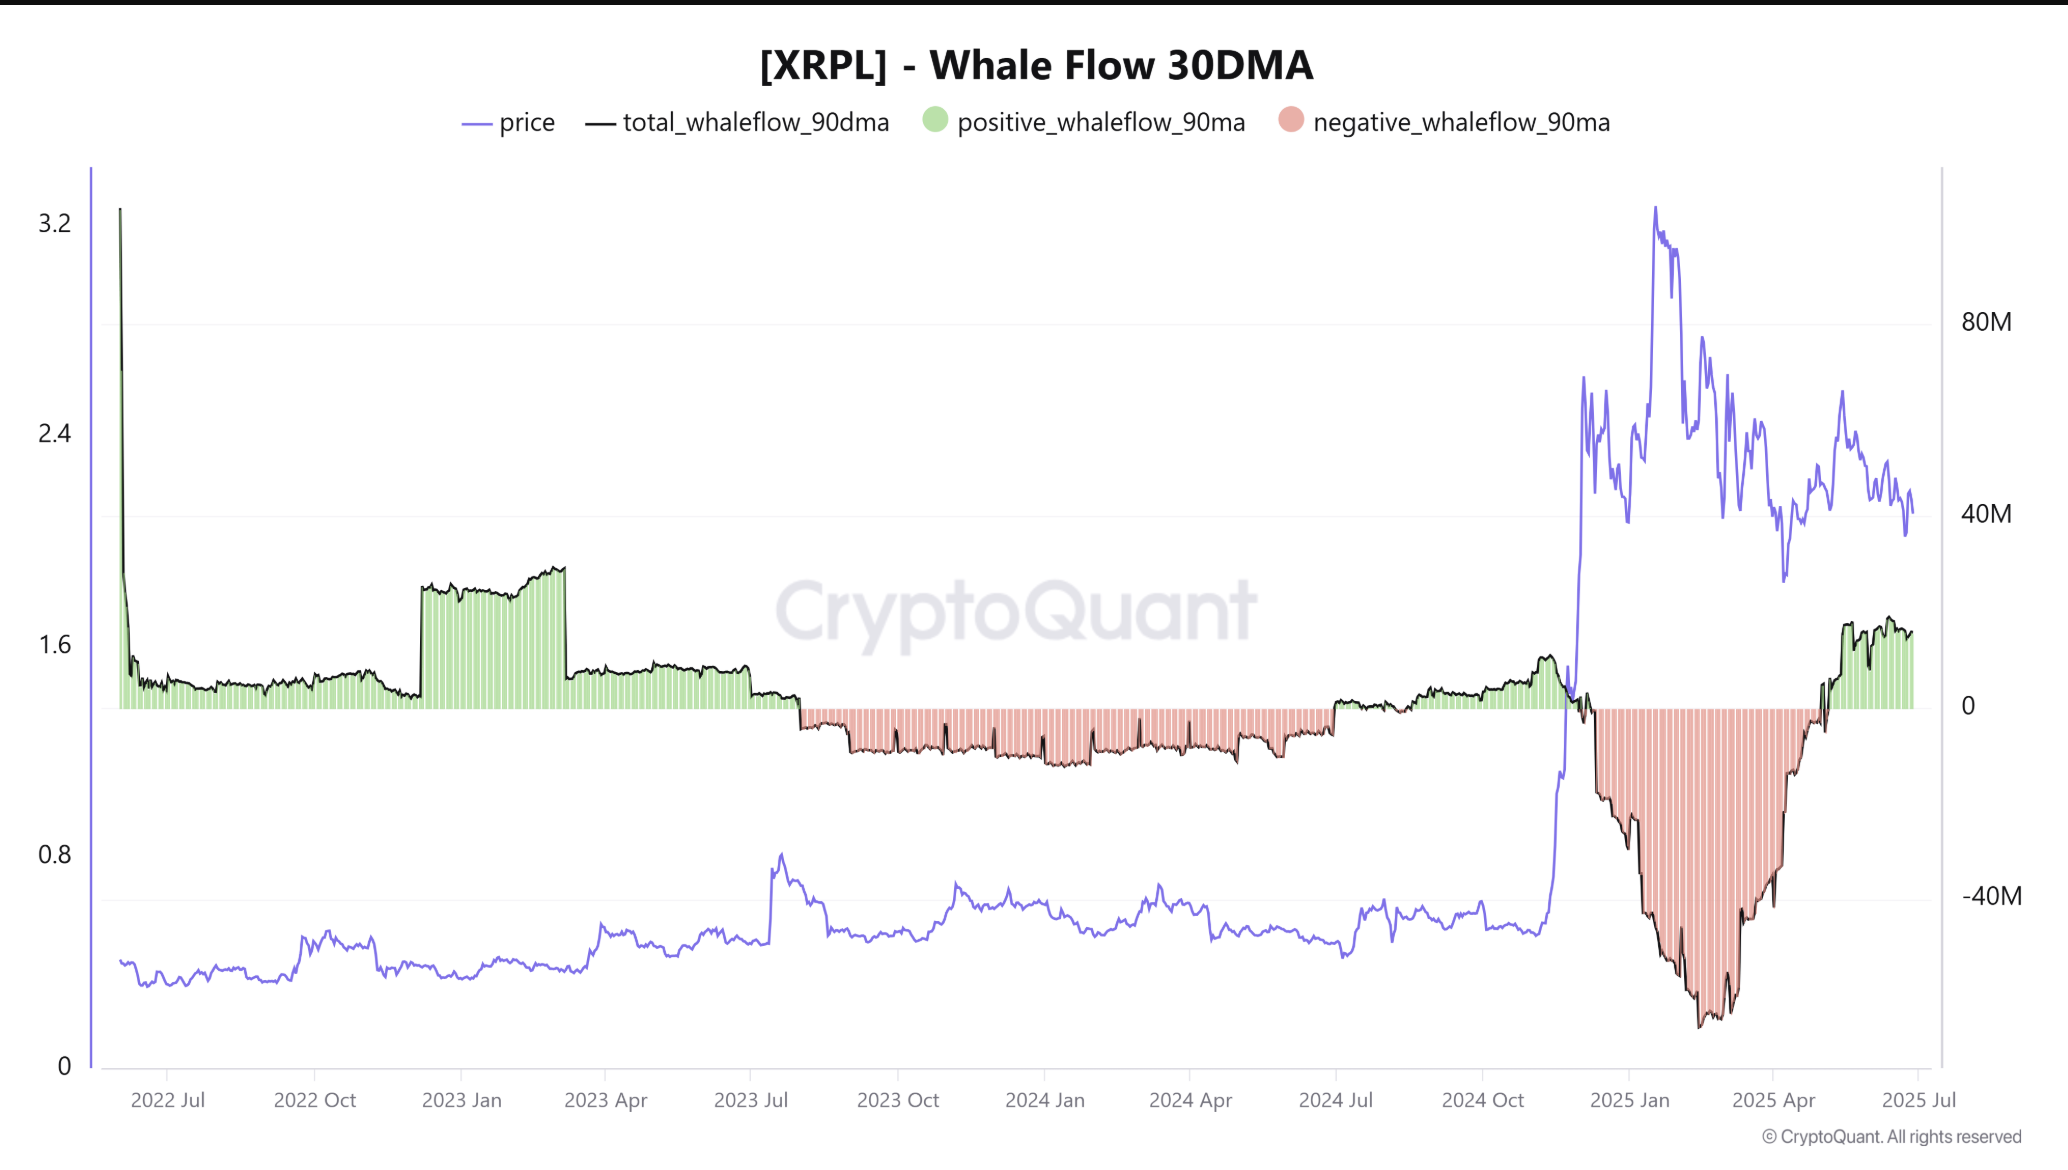
The shift suggests large holders have been positioning lately for a major move, with historical data backing the trend.
For instance, similar accumulation activity began in August 2024 and preceded XRP’s 420% rally in the fourth quarter. As of June 28, these inflows have surpassed 2024’s levels, hinting at renewed confidence among whales.
XRP could chart new highs by late 2025, potentially validating the symmetrical triangle’s bullish breakout target, if the onchain pattern holds.
XRP liquidation heatmap hints at $2.34-2.40
Binance’s XRP/USDT liquidation heatmap highlights the $2.34–$2.40 range as a key resistance zone, with over $525 million in potential liquidations clustered within.
These zones often act as price magnets, with dense liquidity influencing market direction.

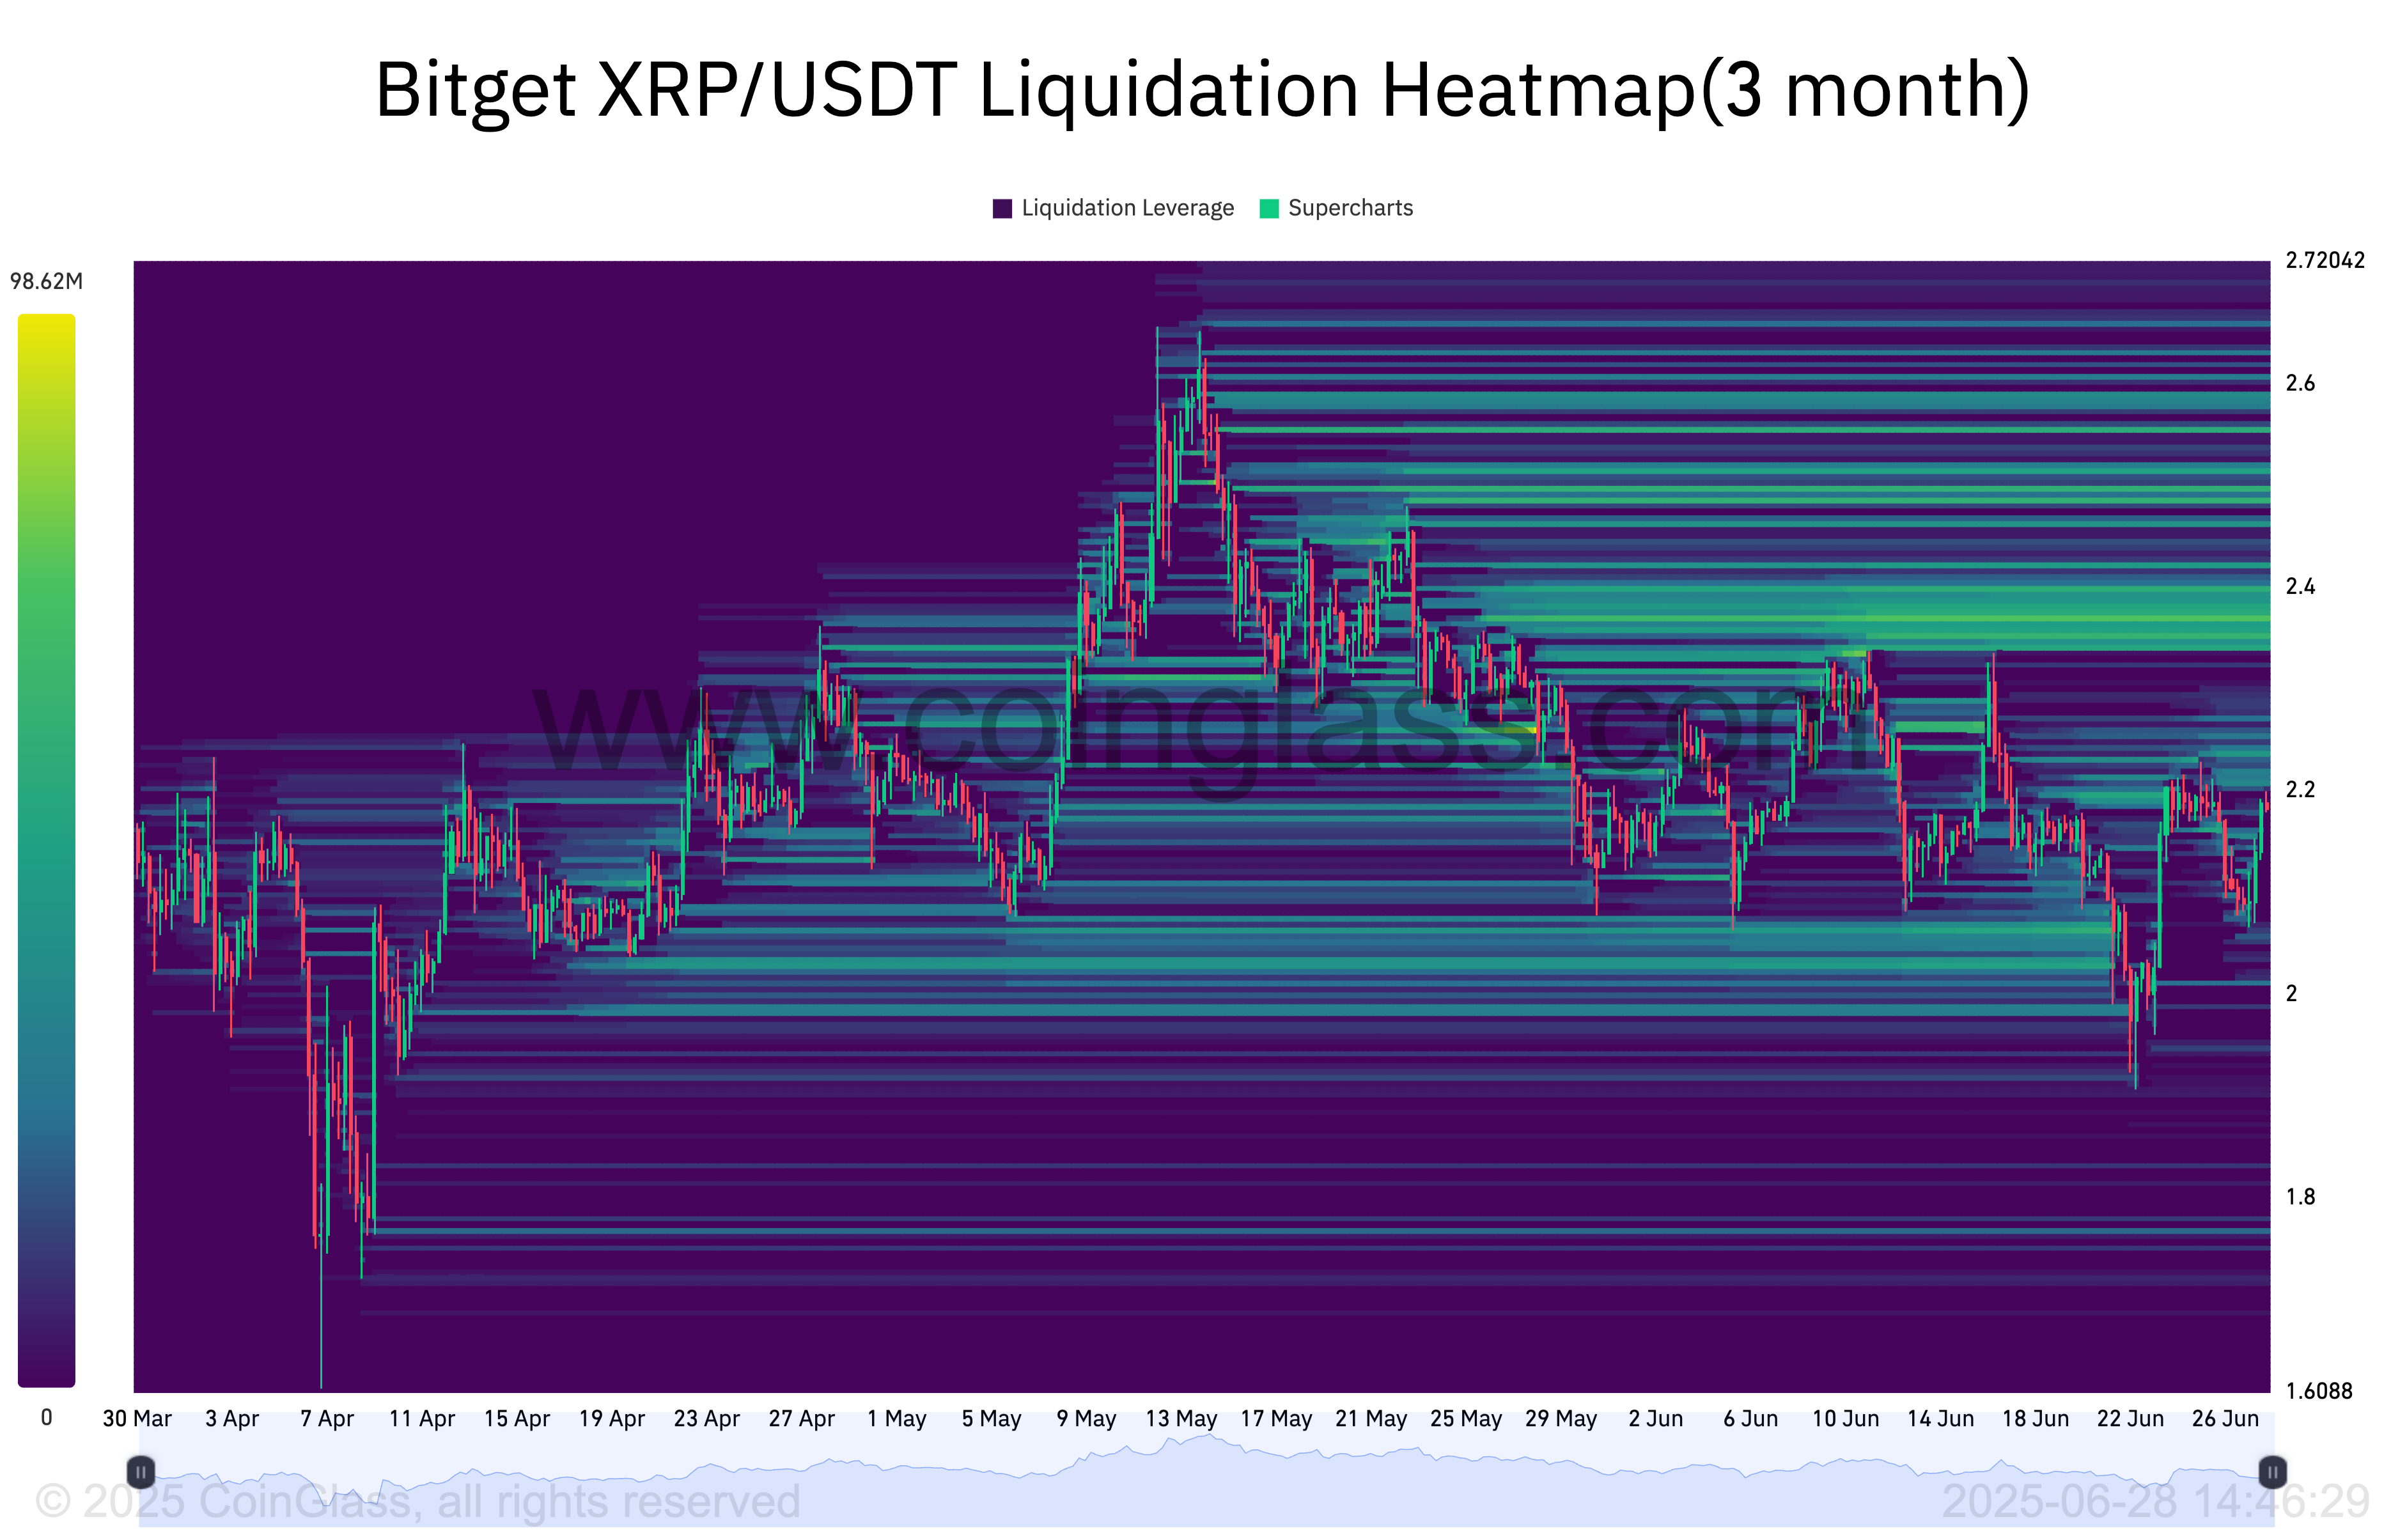
XRP came close to testing the lower bound of this range in June but faced rejection.
Related: Three signs that XRP price will soon break out after 4-month consolidation
A decisive move above $2.34 could flip the script, triggering a short squeeze that forces liquidations and propels the price toward $2.40, potentially setting the stage for further upside.
This article does not contain investment advice or recommendations. Every investment and trading move involves risk, and readers should conduct their own research when making a decision.
Read the full article here


