


The price of Bitcoin (BTC) has declined by more than 17.5% a week after setting a new record high of around $73,800. As of March 20, it has reached a two-week low of $60,760.
Bitcoin’s price drop coincides with anticipations that the Federal Reserve will maintain its key interest rates within the existing 525-550 basis points (bps) range. Furthermore, the continued withdrawals from Bitcoin exchange-traded funds (ETFs) are exacerbating the downward pressure on its price.
Let’s discuss how low can the Bitcoin price go in the ongoing correction cycle.
BTC price could break below $60,000 support in March
The current correction within Bitcoin’s bull market may see it potentially dip below the $60,000 threshold by the end of March.
Notably, BTC could decline toward its 50-day exponential moving average (50-day EMA; the red wave in the chart below) at approximately $58,780. This EMA wave support was instrumental in limiting BTC’s bull market correction in January 2024.
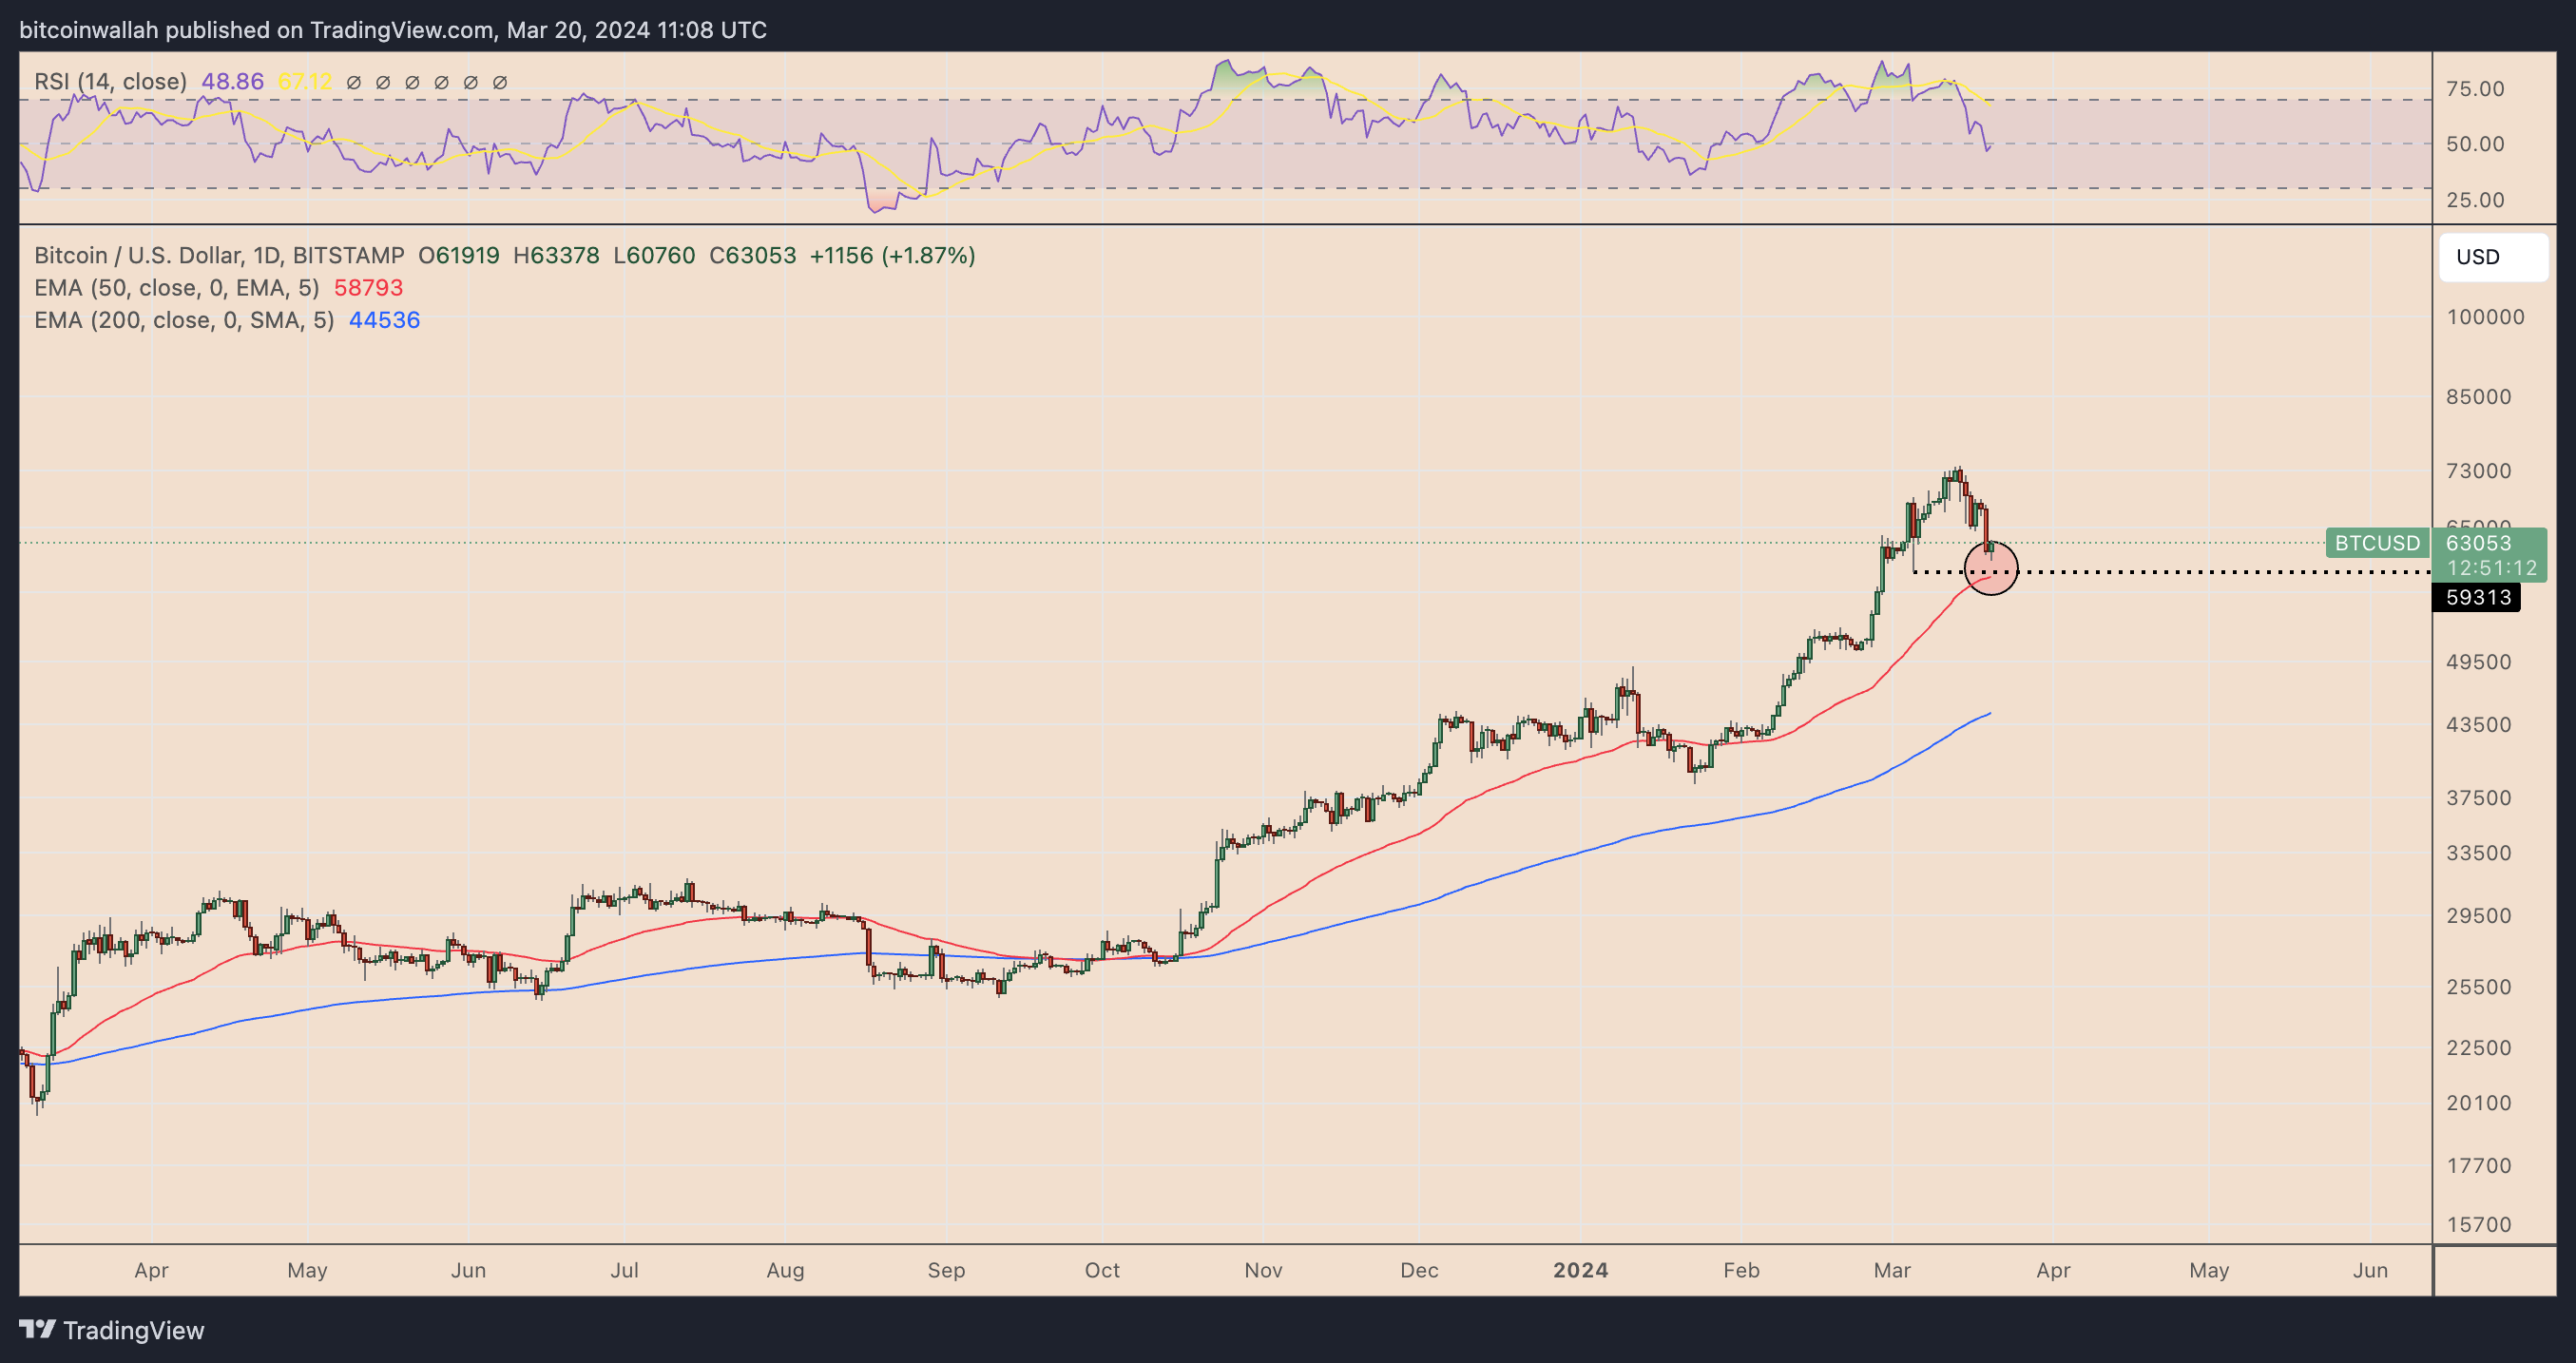
The 50-day Exponential Moving Average (EMA) also aligns with Bitcoin’s horizontal support level of around $59,310. This level, after being tested on March 5, preceded a 24.5% surge in price.
Pre-halving Bitcoin fractal sees price at $40,000
Bitcoin price risks continuing its bull market correction toward $40,000, according to market analyst Rekt Capital.
Rekt Capital’s pessimistic forecast centers on Bitcoin’s pre-halving price trends. The analyst highlighted the current price correction and compared it to the patterns observed before the last two halvings. From a fractal analysis perspective, Bitcoin is now in a “Danger Zone,” eyeing an extended correction toward its ascending trendline support near $40,000.
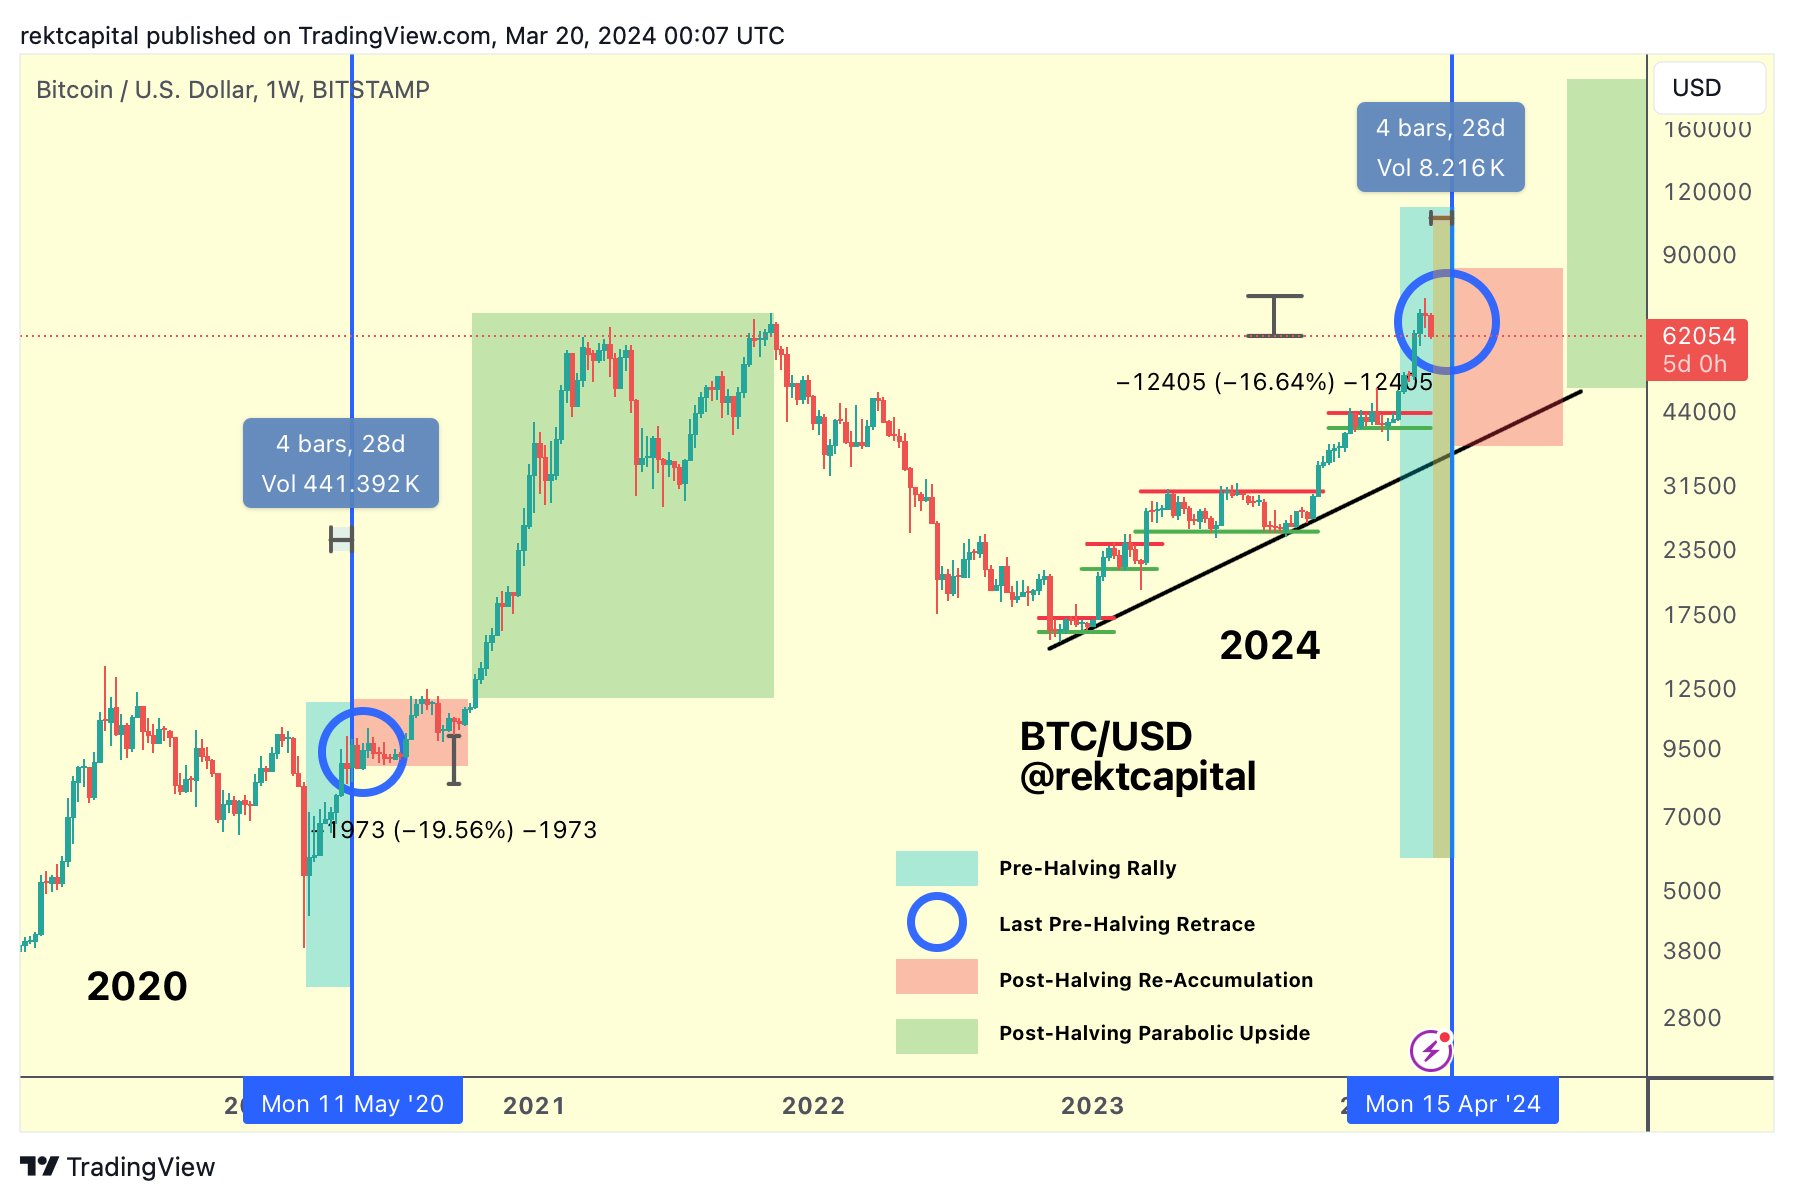
Four years ago, Bitcoin’s price experienced a roughly 50% retracement in the months leading up to the 2020 halving, a downturn significantly intensified by the COVID-19 pandemic in March. Nonetheless, it stabilized around $10,000 for the remainder of the halving year, setting the stage for a bull market revival in 2021.
Similarly, Bitcoin underwent a 33% pullback around the 2016 halving but recovered by year’s end, eventually propelling into a bull market in 2017 that culminated in a peak of $20,000.
Going by the fractal analysis, Bitcoin’s ongoing price correction could eventually be exhausted, followed by a bullish reversal to a new record high, as shown below.
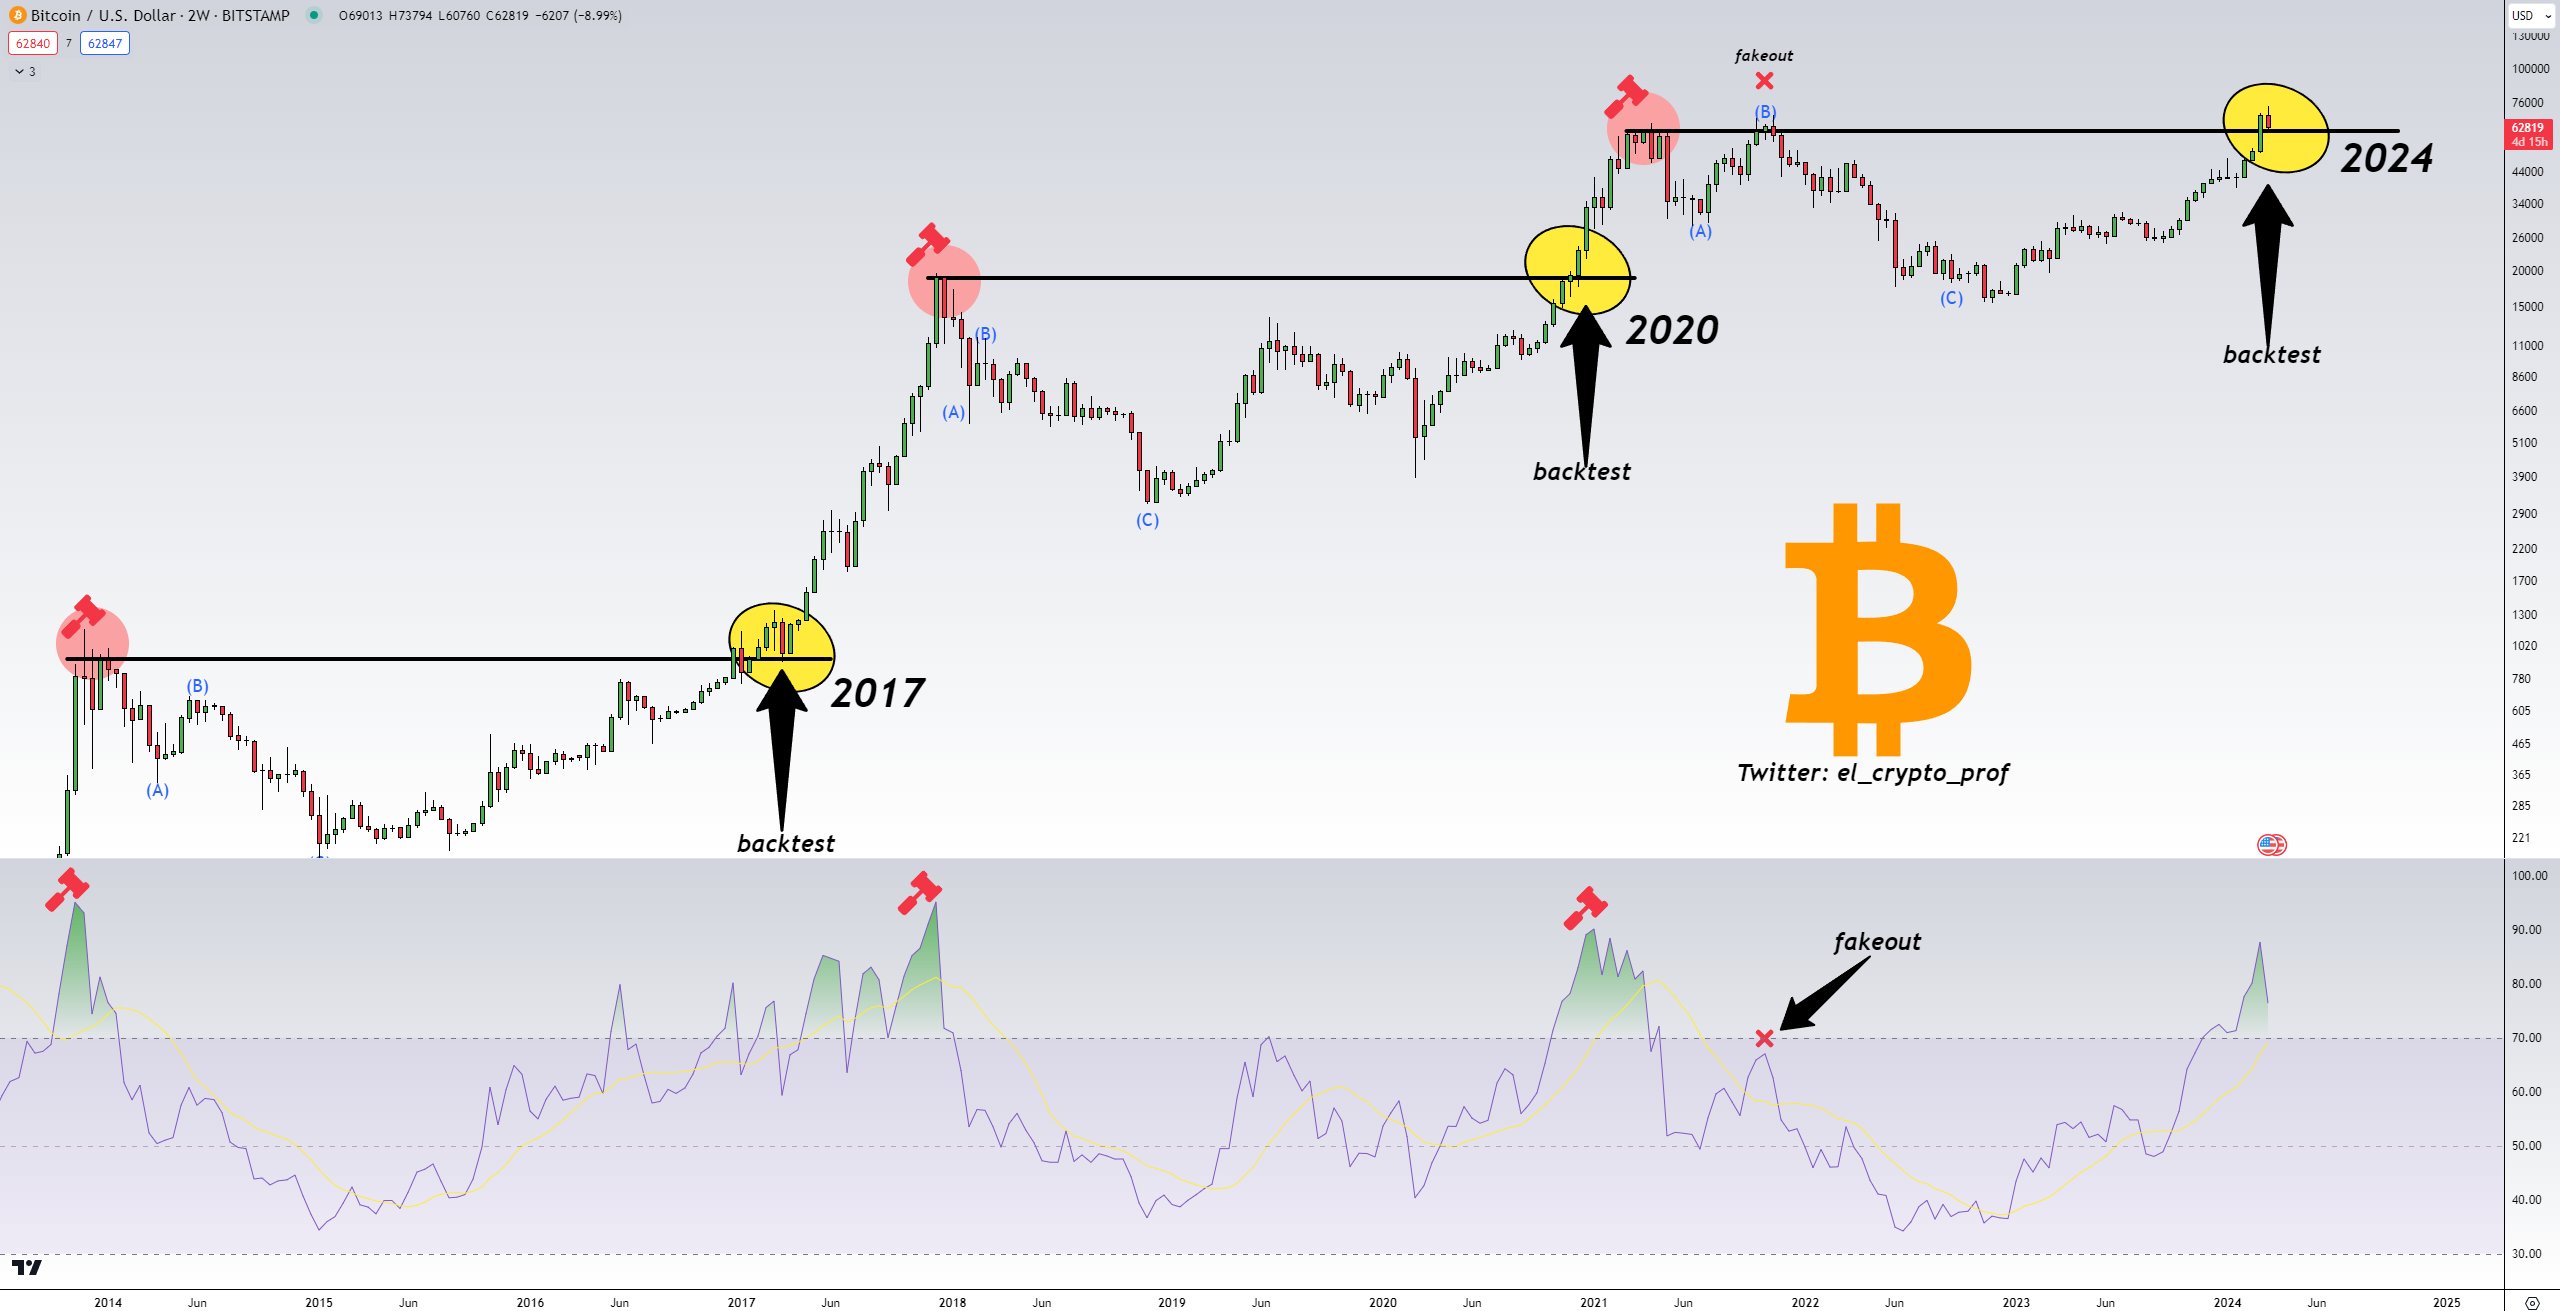
Fibonacci fractal shows potential decline toward $50,000
Fibonacci retracement levels, meanwhile, show Bitcoin will likely consolidate within the $50,000-60,000 range in the coming days or weeks.
Notably, the Bitcoin weekly chart reveals an intriguing price performance around the Fibonacci retracement levels during bullish reversal periods. The 0.618 level, also known as the “Golden Ratio,” is particularly noteworthy.
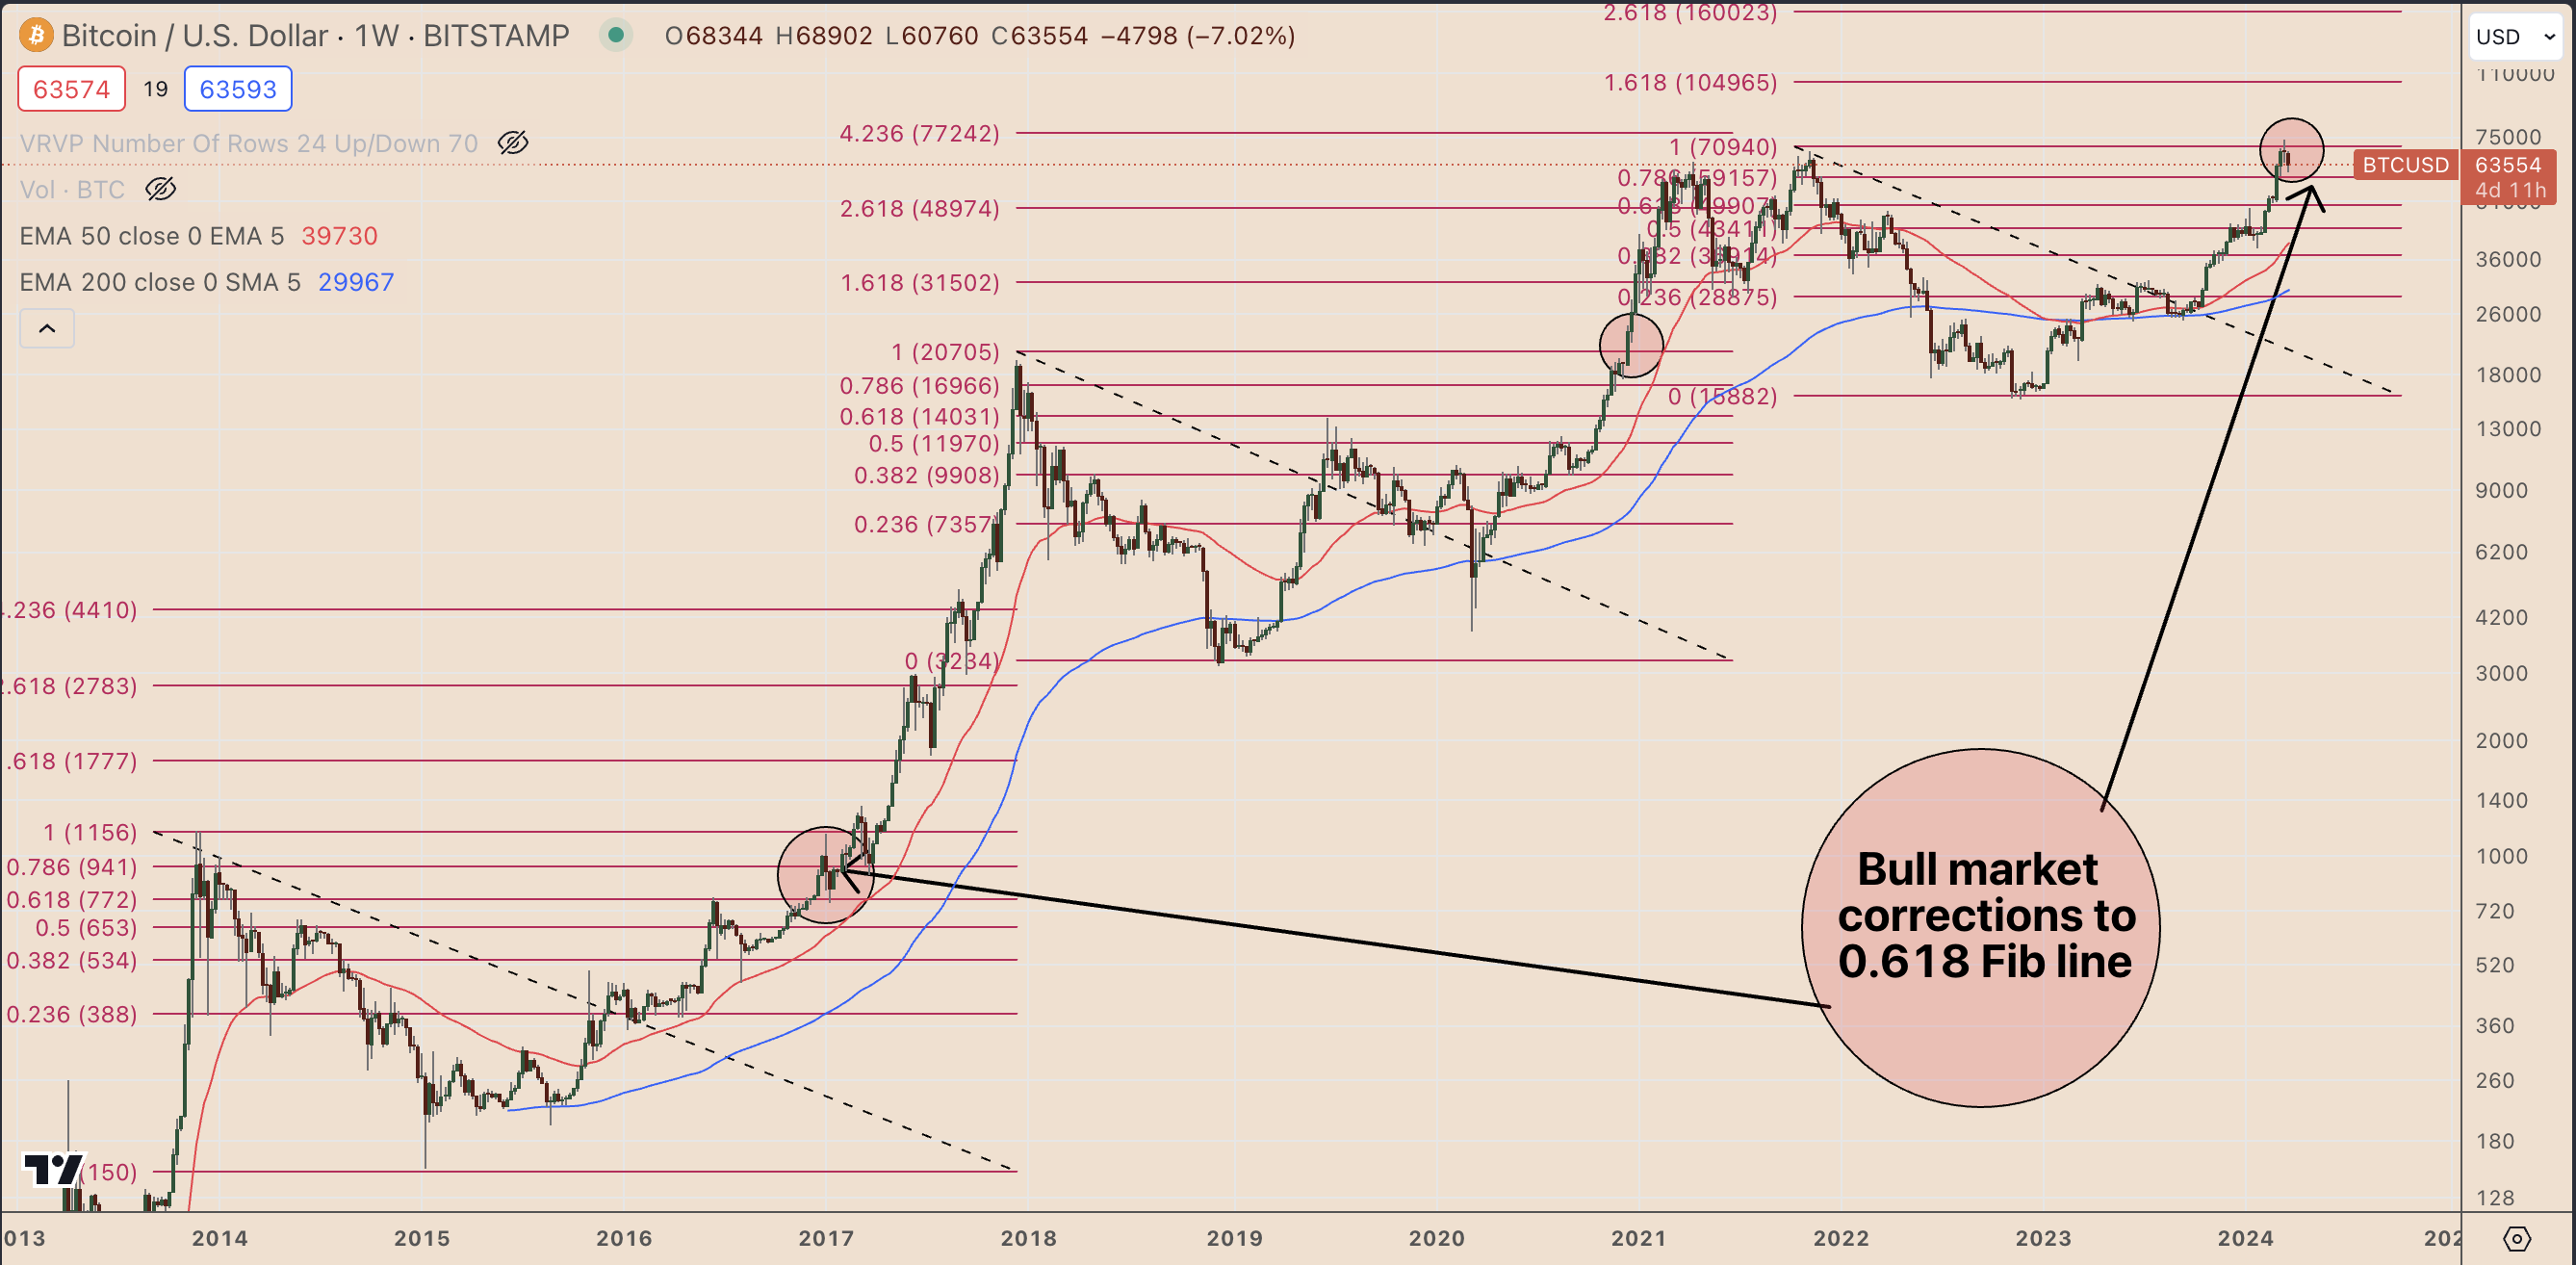
Historically, Bitcoin’s price has frequently tested the 0.618 level as support after approaching or establishing a record high. This is highlighted in the red-shaded area of the chart above, reaffirming that Bitcoin’s next support level could be around $50,000.
The views, thoughts and opinions expressed here are the authors’ alone and do not necessarily reflect or represent the views and opinions of Cointelegraph.
Read the full article here


