


 Moved in Two Hours")

The recent behavior of price, volume, and market positioning suggests a possible consolidation phase is forming, with short-term sentiment subdued but no clear signal of a breakdown.
Short-Term Volatility Followed by Stabilization
On the hourly chart, OP/USD has demonstrated heightened volatility throughout early June. A sharp rally to approximately $0.67 on June 3 was quickly followed by an accelerated decline, culminating in a breakdown below $0.62 on June 5. This move was accompanied by a noticeable surge in aggregated open interest, indicating an increase in speculative trading activity, likely from short positions or forced liquidations.
Source: Open Interest
Following this sharp sell-off, OP’s price stabilized between $0.60 and $0.63, with multiple failed breakout attempts above resistance near $0.62. The inability to gain traction above that zone suggests sellers are still active, capping any significant upward movement. Open interest, which had previously surged, has since leveled off near 3.15 million, reflecting reduced enthusiasm among derivatives traders. This shift points to a more cautious environment as participants await new market signals.
24-Hour Performance Reflects Ongoing Market Caution
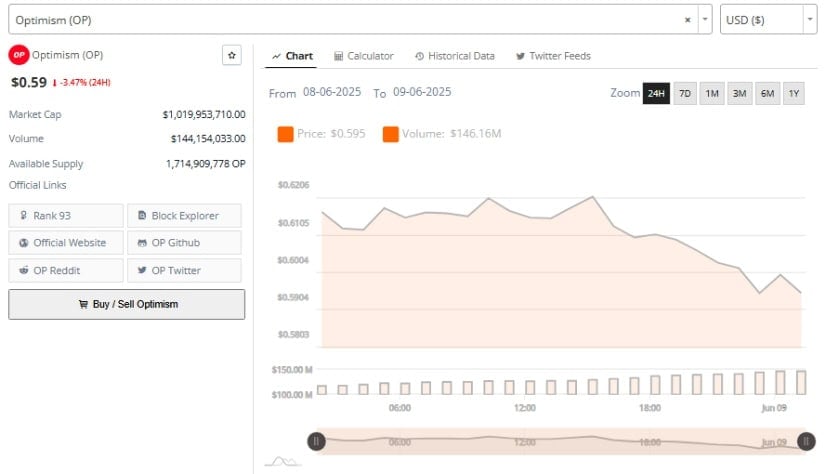
Additionally, over the past 24 hours, Optimism price prediction declined by 3.47%, closing near $0.59. Consistent lower highs and intermittent support tests marked the intraday price structure. Despite brief periods of upward recovery throughout June 9, OP was unable to reclaim key resistance levels and ended the day in negative territory.
Trading volume reached approximately $146.16 million, which, while notable, did not contribute to upward price traction, reinforcing the idea of a neutral-to-bearish market environment.
Source: Brave New Coin
With a current market capitalization of just over $1 billion and a circulating supply exceeding 1.7 billion tokens, Optimism remains a prominent Layer 2 token. However, short-term price performance has lagged in broader market movements, possibly due to macro uncertainty or increased competition among Ethereum L2 solutions.
Even so, Optimism’s foundational role in the Superchain, particularly through adoption by Base and Kraken’s Ink, underscores its long-term relevance in Ethereum scaling.
Optimism Price Prediction: Weekly Indicators Signal Potential Accumulation
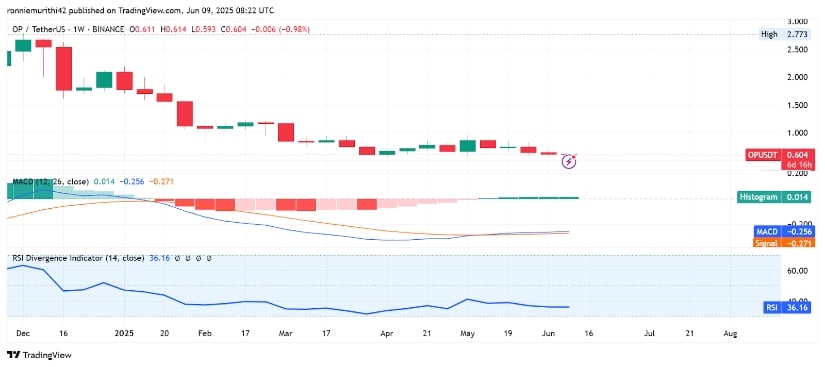
On the other hand, from a broader technical perspective, the weekly chart of OP/USDT shows signs that the extended downtrend may be moderating. Since peaking near $2.77 in 2024, the token has steadily declined in value. However, beginning in April 2025, the pattern of large bearish candles has shifted to smaller-bodied candles with shorter wicks, suggesting a slowing of downside momentum.
As of June 9, the current weekly candle shows a price of $0.604, just above the key psychological support of $0.60.
Source: TradingView
Momentum indicators offer mixed but cautiously optimistic signals. The MACD line remains in negative territory at -0.256, slightly above the signal line at -0.271. This minor gap has resulted in a positive histogram of 0.014, marking the first such occurrence since the start of the downtrend.
While not yet a confirmed bullish crossover, this change suggests declining bearish momentum. A continuation of this pattern could indicate an early-stage recovery if supported by rising volume and positive market sentiment.
Meanwhile, the Relative Strength Index (RSI) has begun to show stabilization. Currently at 36.16, it remains below the neutral 50 level but is no longer trending downward. A shift above 40 in the coming sessions could confirm the start of an accumulation phase. Such behavior typically precedes a price base formation and potentially a reversal, especially when aligned with other bullish momentum signals.
Outlook: Consolidation Key as OP Defends Crucial Support
As Optimism price prediction trades near the $0.60 mark, technical indicators suggest a shift from sharp selling to range-bound consolidation. The RSI’s stabilization and a slightly positive MACD histogram point to weakening downside momentum, though confirmation of recovery is still pending. Market participants will likely monitor the $0.62–$0.63 resistance zone for signs of bullish strength, while the $0.58–$0.60 range continues to serve as a critical support floor.
In the absence of immediate catalysts, OP’s price prediction remains tied to technical structure. A sustained hold above $0.60, combined with improving RSI and MACD readings, could pave the way for a midterm recovery. However, a failure to defend this level may expose the token to further declines toward previous lows. For now, OP remains in a transitional phase, with traders closely watching for momentum confirmation in either direction.
Read the full article here


