Polkadot (DOT) daily chart shows a classic bullish pennant. It is a continuation pattern that often precedes the next move higher in an upward trend.
Polkadot $DOT has caught the eye of traders. Analysts say that DOT looks ready to break out of a bull pennant, heading to $17.
With the breakout, it could be a big move for Polkadot. Its current price is in the region of $6.3.
But, with the market at large in flux, DOT’s breakout has both technical and fundamental challenges to break through.
Source: X
Polkadot Prices Struggle to Gain Traction
Although people are quite optimistic about the bullish pennant, Polkadot’s bullish move has not played out favourably yet.
In the past 24 hours, DOT has been trading sideways. Its price fell slightly by 2.92% to be currently trading around $6.30.
– Advertisement –
24-hour trading volume is actually down 37% on the day to $169.94 million, showing sluggish market conditions.
This is characteristic of diminishing investor interest and may indicate traders complacency in waiting for a breakout to be confirmed.
At the time of writing, Polkadot’s market cap was at $9.71 billion. Though bullish, the dearth in recent momentum suggests bulls may no longer be able to muster the strength to push price up.
Technical Analysis and the Case for a Bullish Breakout
Bullish pennant on Polkadot’s chart appears to favor bull traders. An asset that’s set to continue a move after a large price action pauses and consolidates, forming a triangle like structure called pennants.
For DOT, the pennant is seen as a natural and healthy development after a swift rally from $3.75 to $10.68 at the end of 2024.
When we look at the Fibonacci retracement levels, we can tell these are key support and resistance areas for DOT.
The strong support at $6.32 served as a previously strong 0.5 Fibonacci level that has prevented more downside.
Polkadot must break out through the 0.618 Fibonacci retracement level at $7.16 to confirm the breakout.
If this zone can act as a successful breach point, a rally toward $10.68 (1.0 Fibonacci level) and the $17 target given by analysts could be possible.
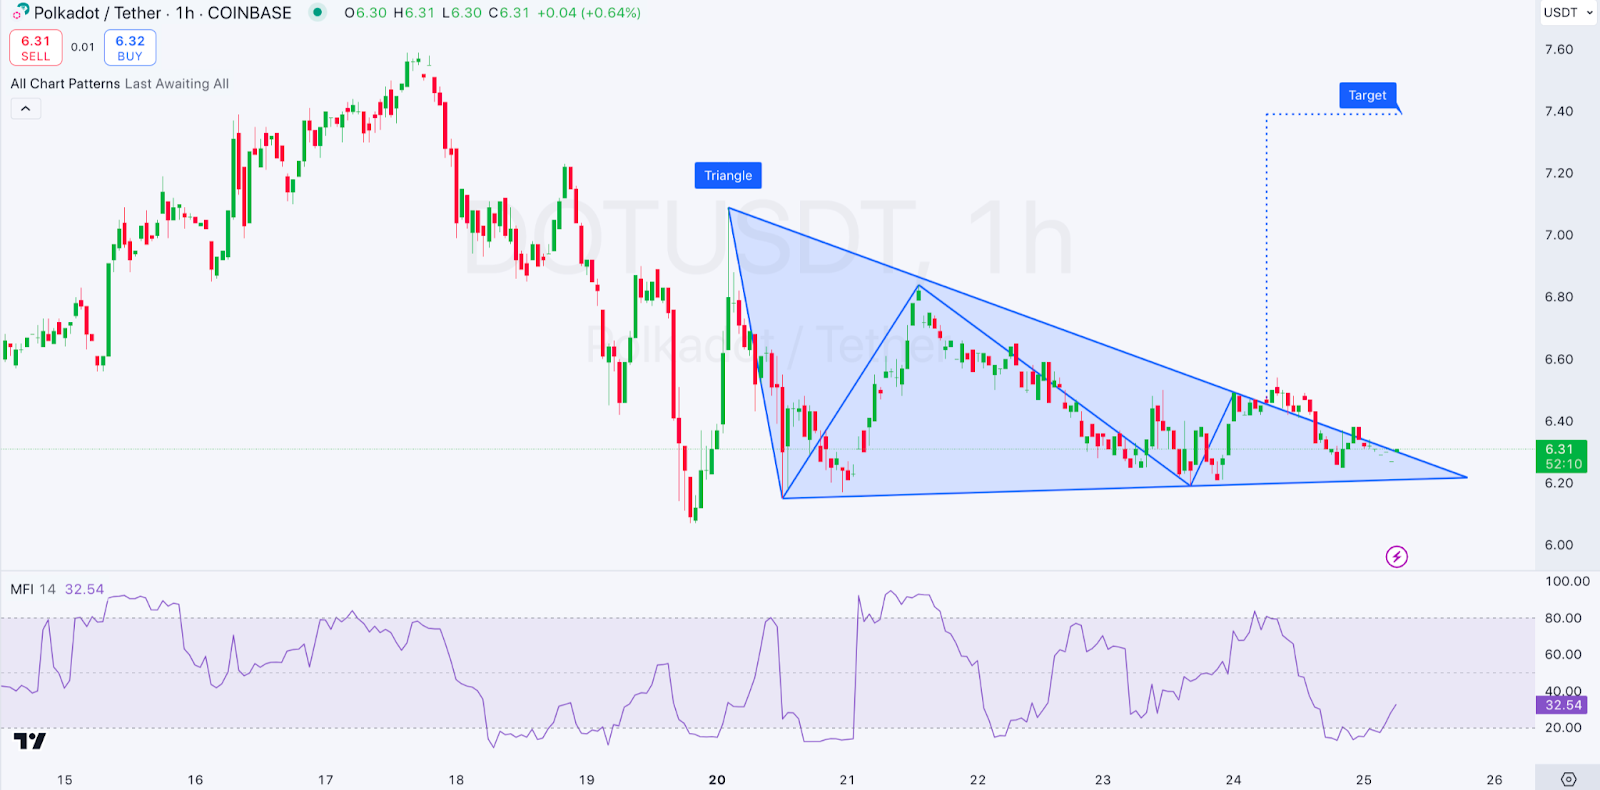
If we look at a 1-hour chart for DOT/USDT, we can see a clear symmetrical triangle pattern to form after a significant downtrend which means the prevailing trend could either continue or reverse.
The triangle, with its converging trendlines, shows a phase of price consolidation while the market is planning its decisive breakout.
This will determine which direction the breakout will go in and whether the bearish momentum of recent has continued or has been reversed back up.

1-hour DOT/USDT Chart | Source: TradingView
The price currently is at $6.31 and if we look at it from a technical perspective, it looks like it’s been going up very slightly. There is a hint of indecision in trends for the market participants.
Future Outlook
The vertical line, at the widest part of the triangle, notes the target projection. A breakout above the upper trendline may result in a price target of $7.40 for DOT.
On the other hand, a breakdown under the lower boundary could continue with larger declines targeting levels around $6.00 or lower.
At the bottom of the chart the Money Flow Index (MFI) is noted at 32.54 which is barely above oversold territory. It is however moving north showing increasing attention.
But also notice the low MFI reading, which shows caution, a low MFI reading suggests if prices go higher, momentum of seller dominance could easily push prices lower.
Read the full article here


