


 Price Prediction for June 25")

Bitcoin is trading at $105,138 as of June 24, 2025, with a market capitalization of $2.09 trillion. Its 24-hour trading volume stands at $52.63 billion, within an intraday price range of $100,177 to $105,927, reflecting a strong rebound from recent lows and renewed market activity.
Bitcoin
On the daily chart, bitcoin shows signs of a reversal after a pronounced mid-term downtrend from $112,000 to a recent low near $98,240. A bullish reversal candle accompanied by increased volume suggests renewed buying interest. The current support level sits firmly at $98,000, while resistance looms between $106,000 and $108,000. Maintaining a position above $104,000 is critical for sustaining this upside momentum. The daily bias remains cautiously optimistic, contingent on price action staying above this threshold.
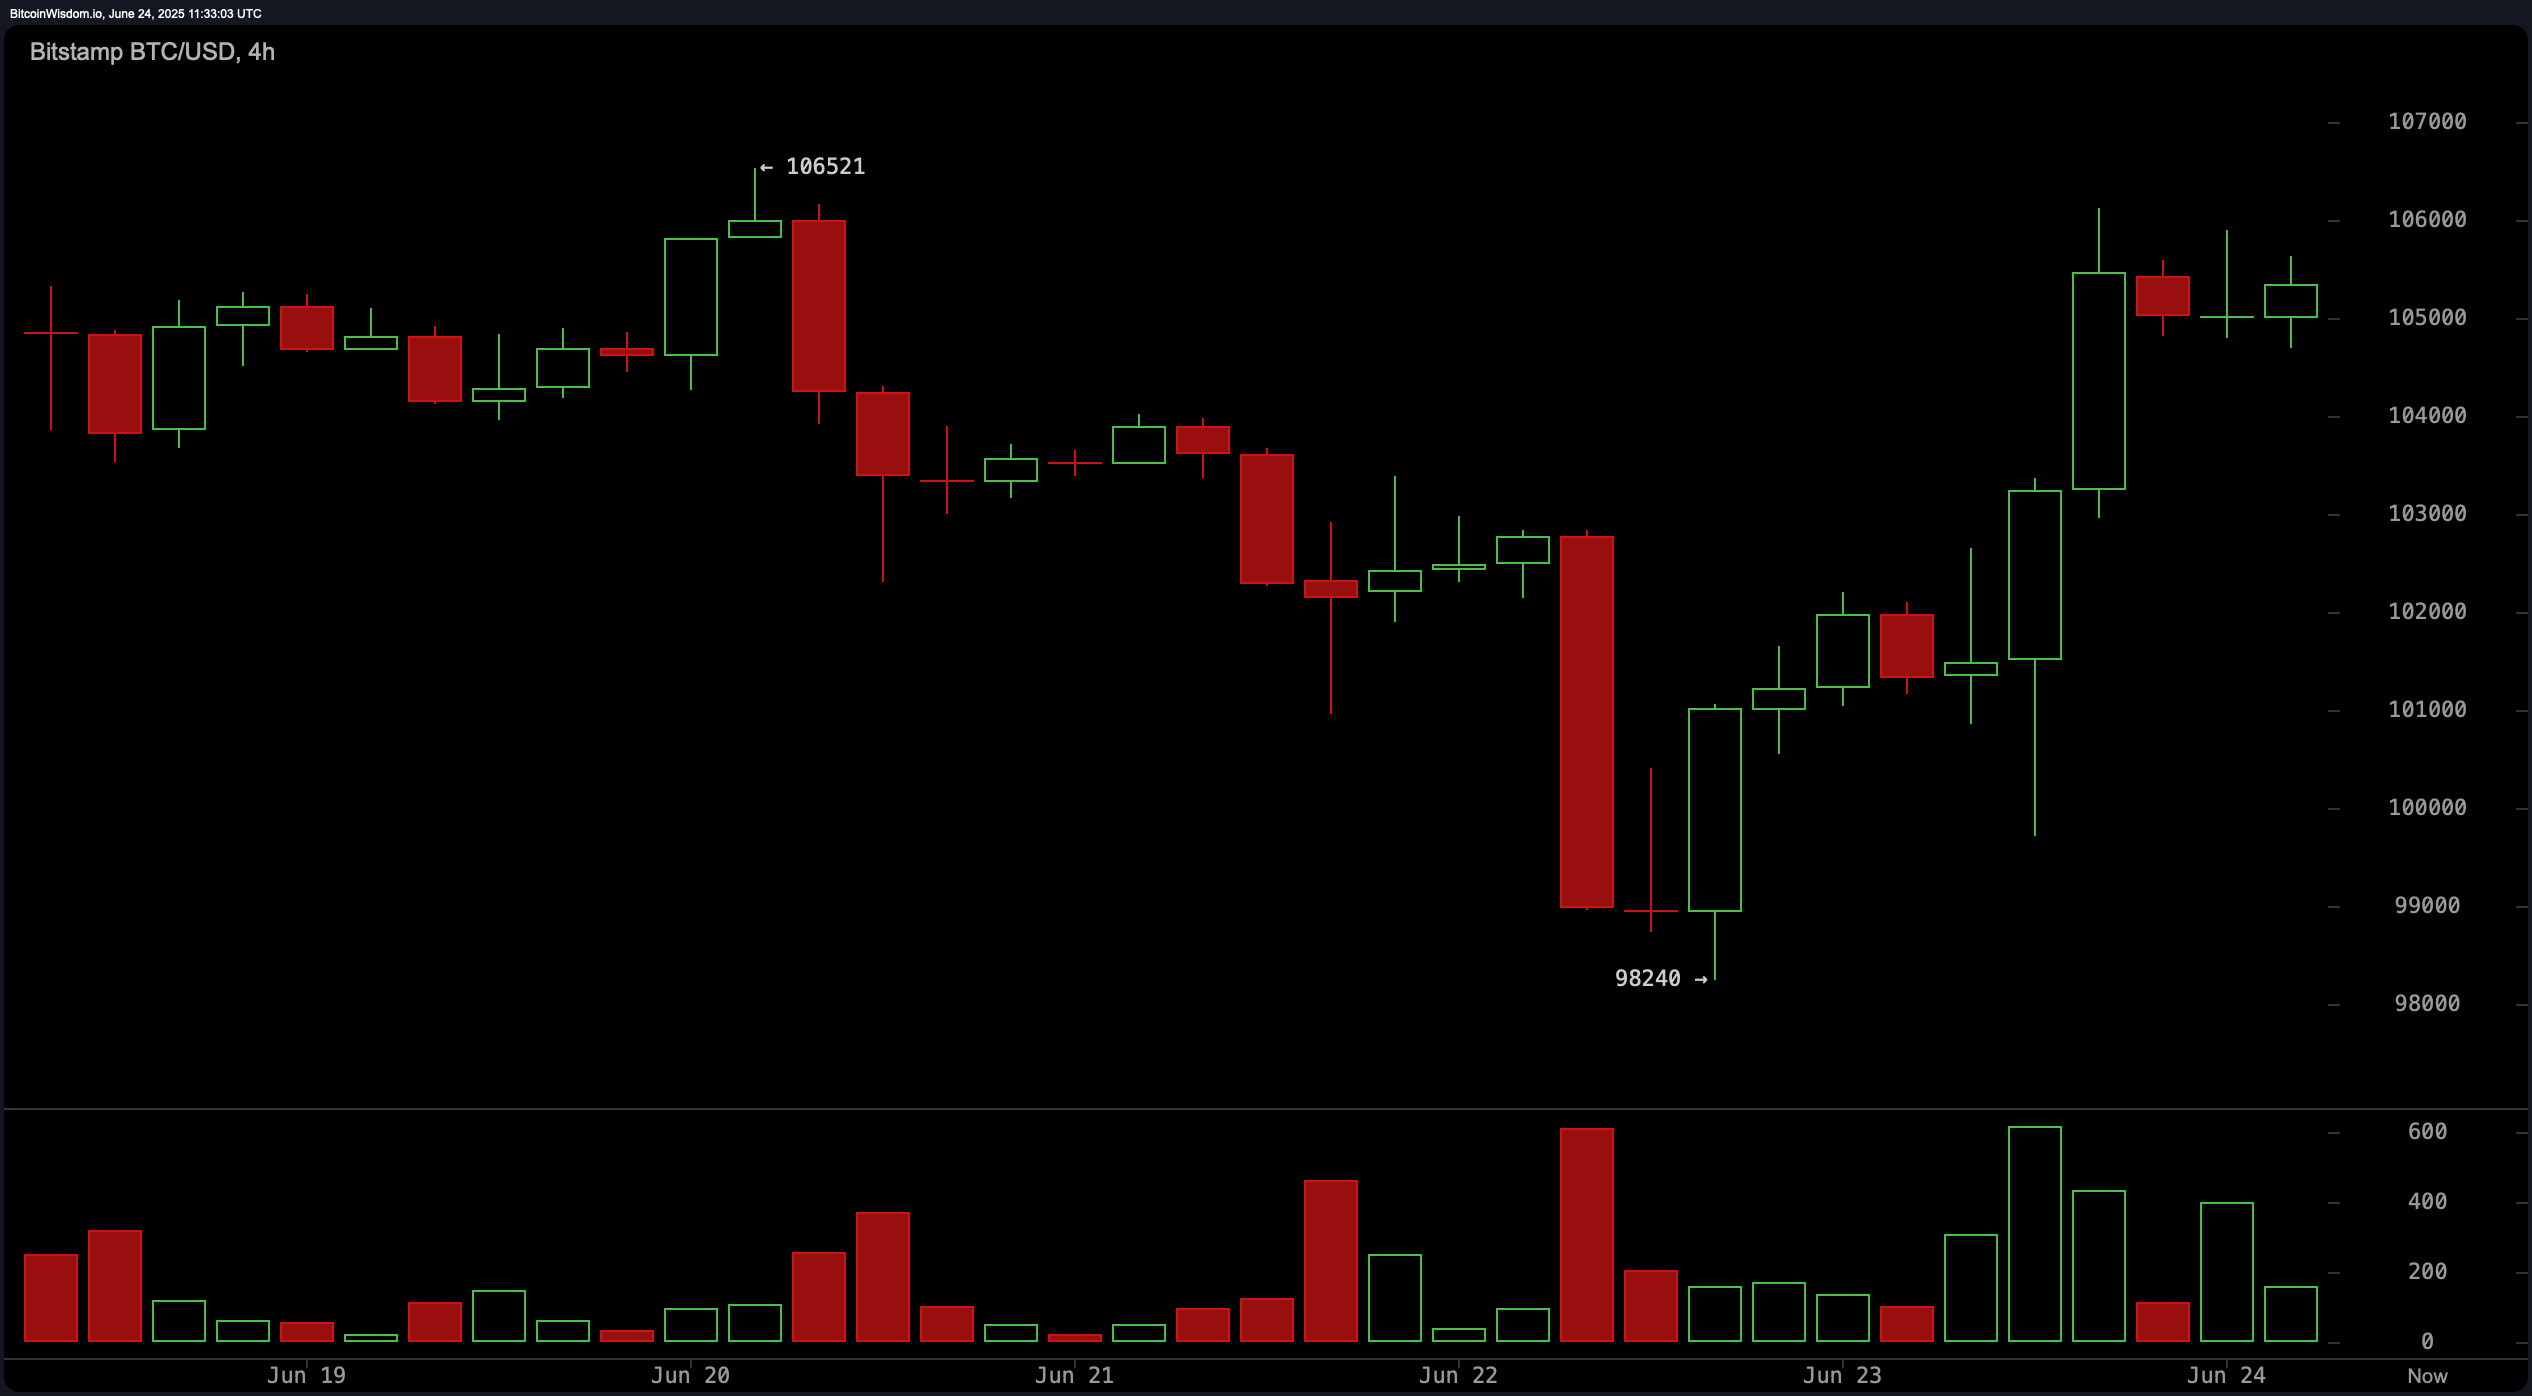
The 4-hour bitcoin chart reveals a pronounced V-shaped recovery, reinforcing the bullish short-term narrative. After bottoming out at $98,240, bitcoin surged with strength, supported by rising green volume bars and consolidation just below the $106,000 resistance. A breakout above $106,500, especially with volume confirmation, could pave the way for a move toward $108,000 or higher. This timeframe reinforces active bullish participation, suggesting upward continuation if critical resistance is cleared.
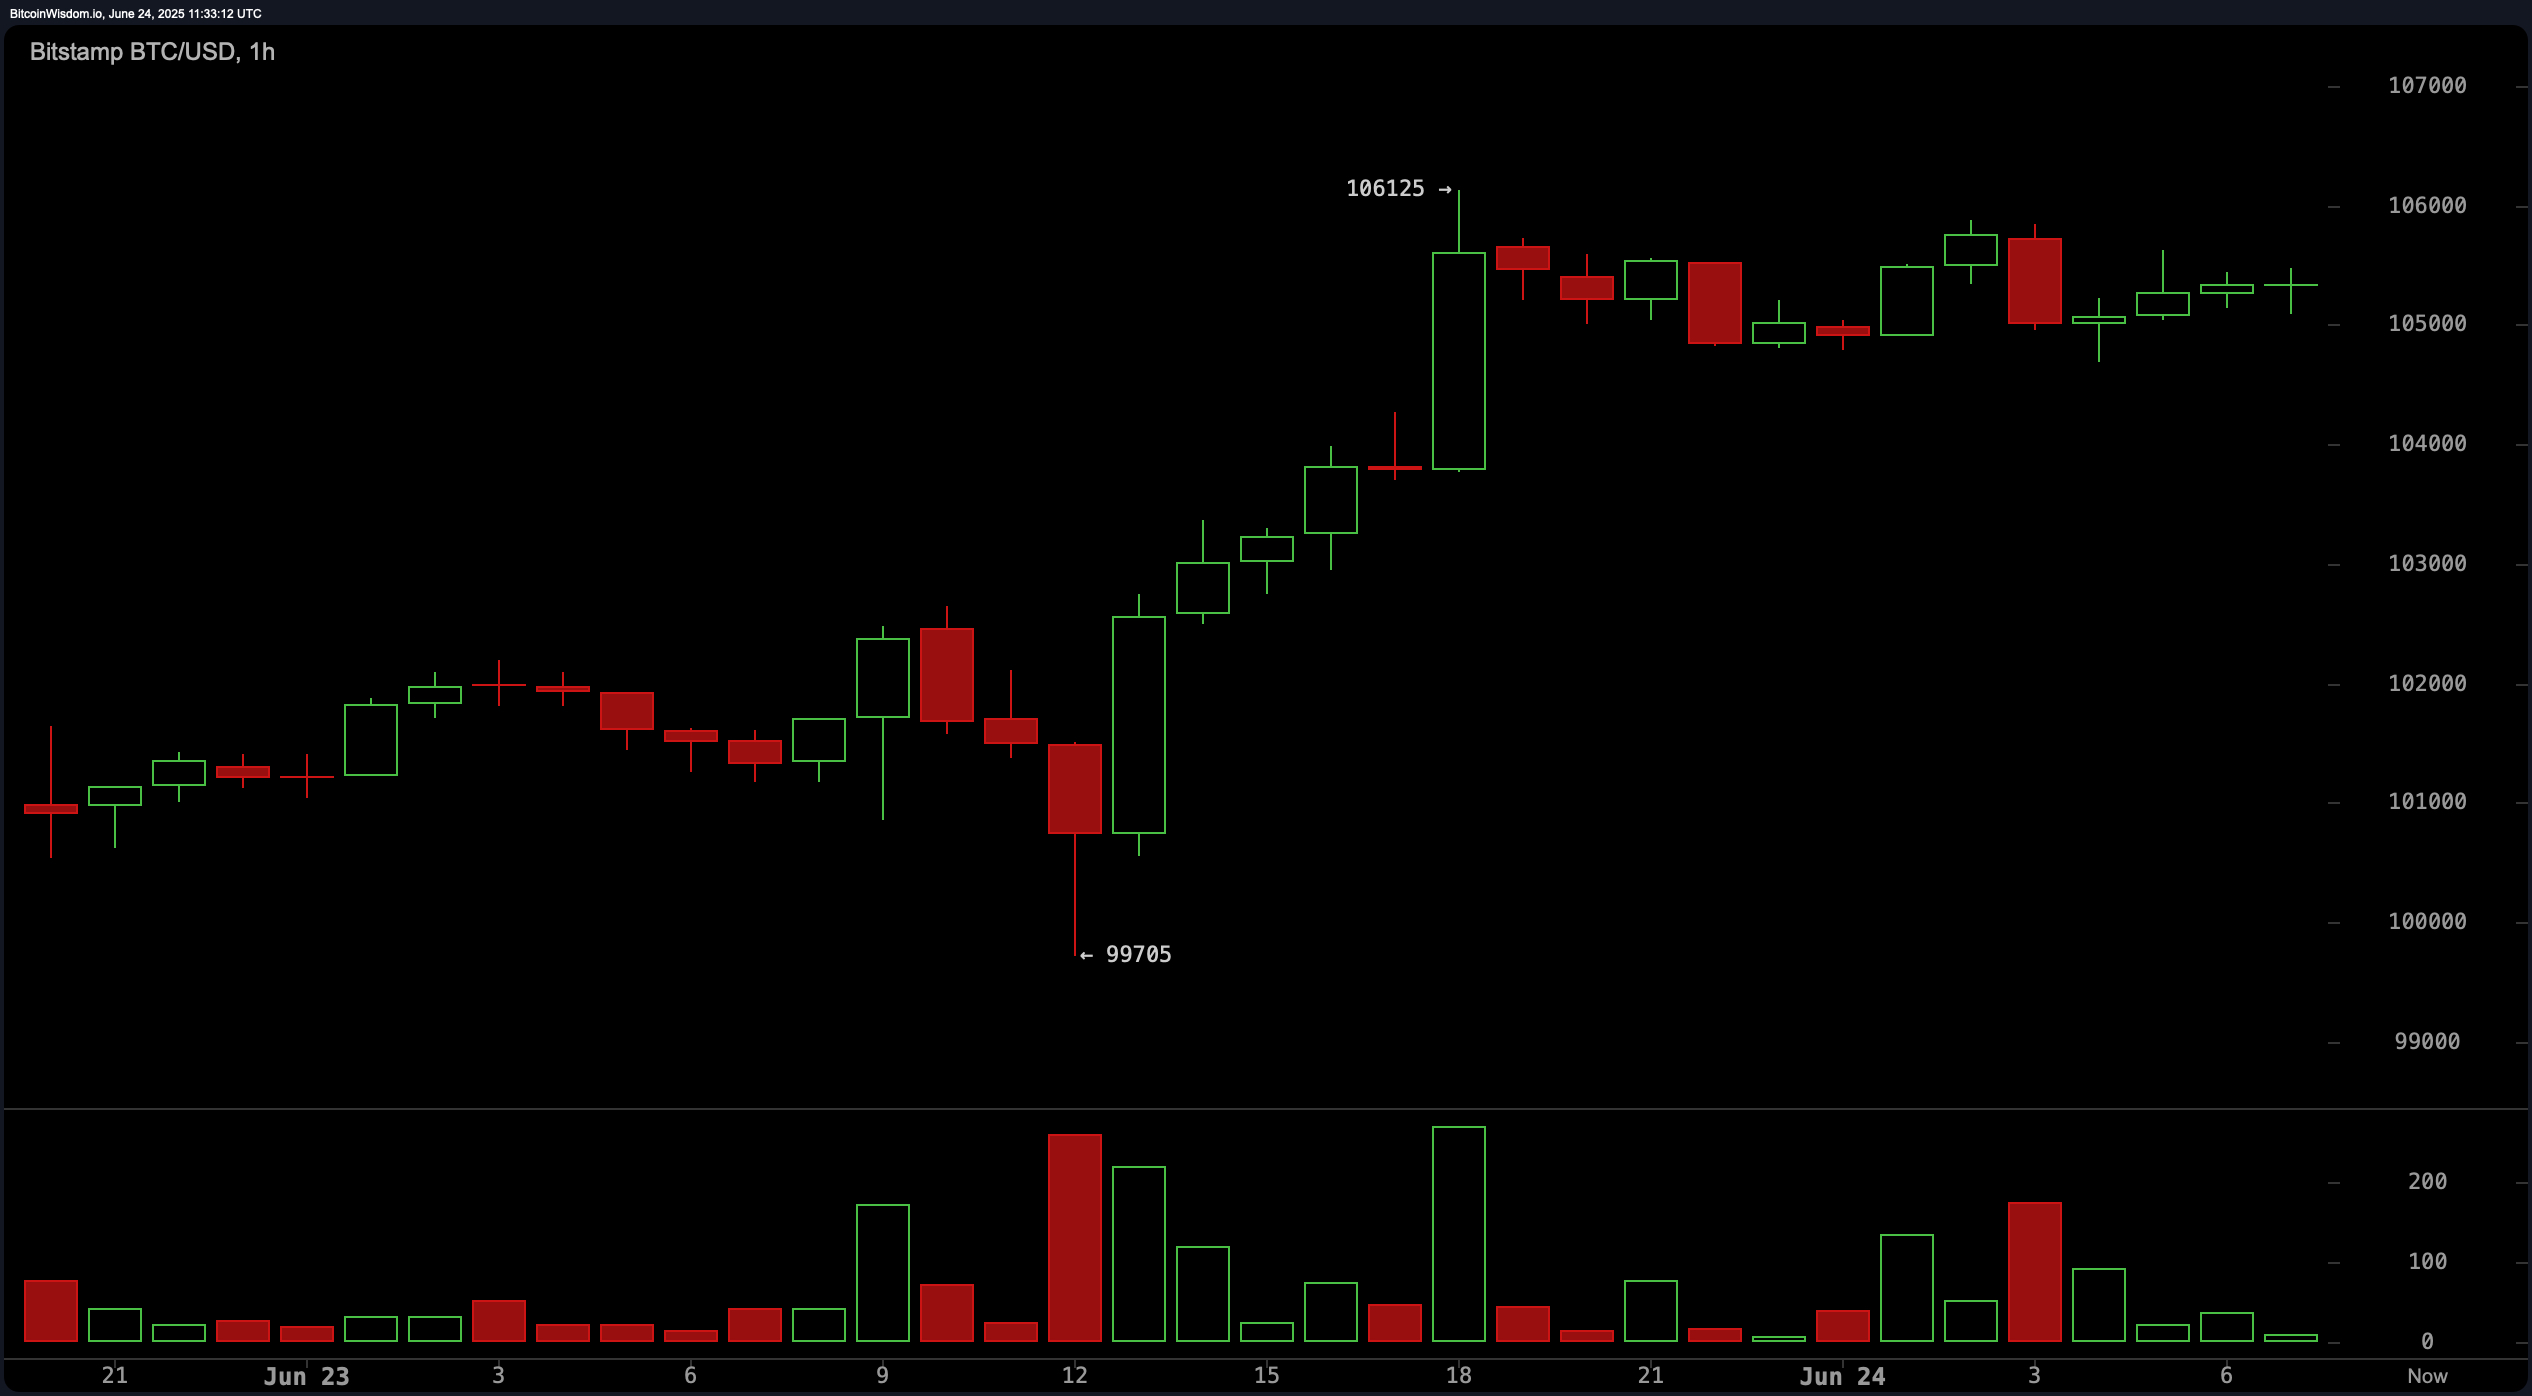
In the 1-hour chart, bitcoin displays a strong uptrend from $99,705, marked by a sequence of higher highs and higher lows. The price is consolidating between $105,000 and $106,000, potentially forming a bullish flag pattern. Although volume has tapered slightly, indicating the possibility of a minor pullback, a retracement toward the $104,500–$105,000 range may present an opportunity for long entries. The bias remains bullish, though cautious positioning is advised near resistance zones.
Technical indicators present a mixed yet slightly favorable outlook. Among the oscillators, the relative strength index (RSI) at 52, Stochastic at 47, commodity channel index (CCI) at 3, and average directional index (ADX) at 18 all signal neutrality. The awesome oscillator at −2,816 also supports this stance. However, the momentum indicator at −24 suggests a buying opportunity, while the moving average convergence divergence (MACD) level at −276 indicates a lingering bearish trend. This mix suggests a market at a potential inflection point.
Moving averages (MAs) underscore the prevailing bullish undercurrent. All exponential moving averages (EMA) — from the 10-period ($104,482) to the 200-period ($93,803) — signal a bullish trend. The simple moving averages (SMA) tell a slightly more nuanced story, with the 30-period SMA ($105,674) issuing bearish sentiment and the rest — including the key 50-period ($105,296) and 200-period ($96,017) — supporting bullish conditions. This convergence of trend-following indicators suggests a strengthening technical backdrop, provided bitcoin can maintain upward momentum through key resistance zones.
Bull Verdict:
If bitcoin sustains momentum above the $104,000 level and breaks decisively through the $106,500 resistance with strong volume, the path toward $108,000 becomes technically viable. Favorable moving average alignments and a bullish pattern on the hourly and 4-hour charts support a continuation of the upward trend, making a bullish outcome the dominant short-term scenario.
Bear Verdict:
Should bitcoin fail to clear the $106,500–$108,000 resistance band and selling pressure emerge, a retracement toward $102,500 or even the $98,000 support could follow. The sell signal from the moving average convergence divergence (MACD) and neutral readings across oscillators suggest vulnerability if bullish momentum wanes.
Read the full article here

 Price Prediction for June 25")

