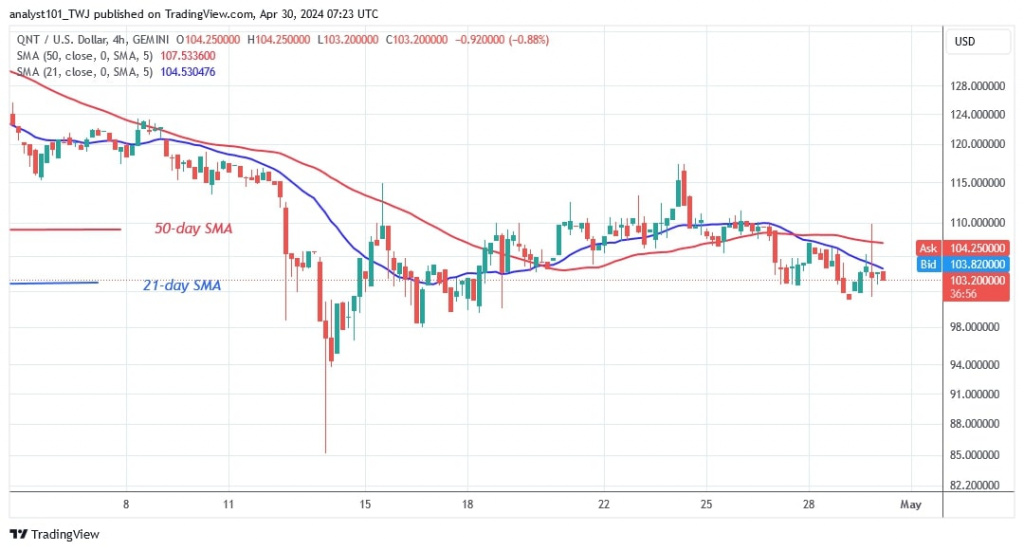
Quant’s (QNT) price has dropped below moving average lines and faces rejection at upper resistance at $150.
Long-term Quant price forecast: bearish
Quant price recovery has been hampered by the persistent rejection at the $150 overhead resistance since December 26, 2023. On April 14, 2024, the cryptocurrency’s selling pressure persisted above the $91.50 support level. Coinidol.com reported last week on the bearish trend of Quant.
The current support is holding as the altcoin continues to move in a range between $91 and $110. The 21-day SMA has resisted the upside reversal twice as the cryptocurrency fell.
On the downside, if the altcoin retraces and remains above the current support level, the range-bound move will continue. The altcoin will fall back to its previous low of $85 per unit if the current support is broken. Quant is currently worth $101.30.
Analysis of the Quant price indicator
The price bars are below the downward sloping moving average lines. However, the price bars are at odds with the 21-day SMA. On both charts, the altcoin is showing a bearish crossover as the 21-day SMA crosses below the 50-day SMA. The bearish signal has weakened above the critical support of $100.
Technical Indicators
Key supply zones: $140, $150, $160
Key demand zones: $90, $80, $70
What is Quant’s next move?
Quant is down after reaching resistance at $116. The cryptocurrency has dropped to a price range of $98 to $116. The altcoin has crashed and is now hovering above the critical support of $100. On the downside, the bulls have defended the current support level since November 22, 2023.

Disclaimer. This analysis and forecast are the personal opinions of the author and are not a recommendation to buy or sell cryptocurrency and should not be viewed as an endorsement by CoinIdol.com. Readers should do their research before investing in funds.
Read the full article here

