Toncoin price is currently in a critical phase, down 12% in the last 30 days. The RSI for TON has moved into a neutral zone, reflecting uncertainty among traders about its next direction.
Simultaneously, a modest increase in supply on exchanges signals potential selling pressure. The EMA lines display a bearish configuration, but narrowing gaps between them hint at a possible momentum shift in the near future.
TON RSI Is Currently Neutral
TON’s Relative Strength Index (RSI) has recently dropped to 44.50, down from 54 just a day ago. This decline indicates that the buying pressure for TON has decreased, suggesting a weakening in the recent upward momentum.
The drop into the 40s signals that bearish sentiment might be gaining strength compared to earlier levels.
Read more: Top 9 Telegram Channels for Crypto Signals in October 2024
TON RSI. Source: TradingView
RSI, or Relative Strength Index, is a momentum indicator that measures the speed and change of price movements. It ranges from 0 to 100, with values above 70 indicating overbought conditions and values below 30 suggesting oversold conditions. Currently, TON’s RSI at 44.50 is sitting in a neutral zone.
It points to some loss of buying momentum, but it does not indicate extreme selling pressure. The RSI being close to 50 still leaves the possibility for price swings in either direction, depending on upcoming market sentiment.
Toncoin Supply on Exchanges Is Increasing
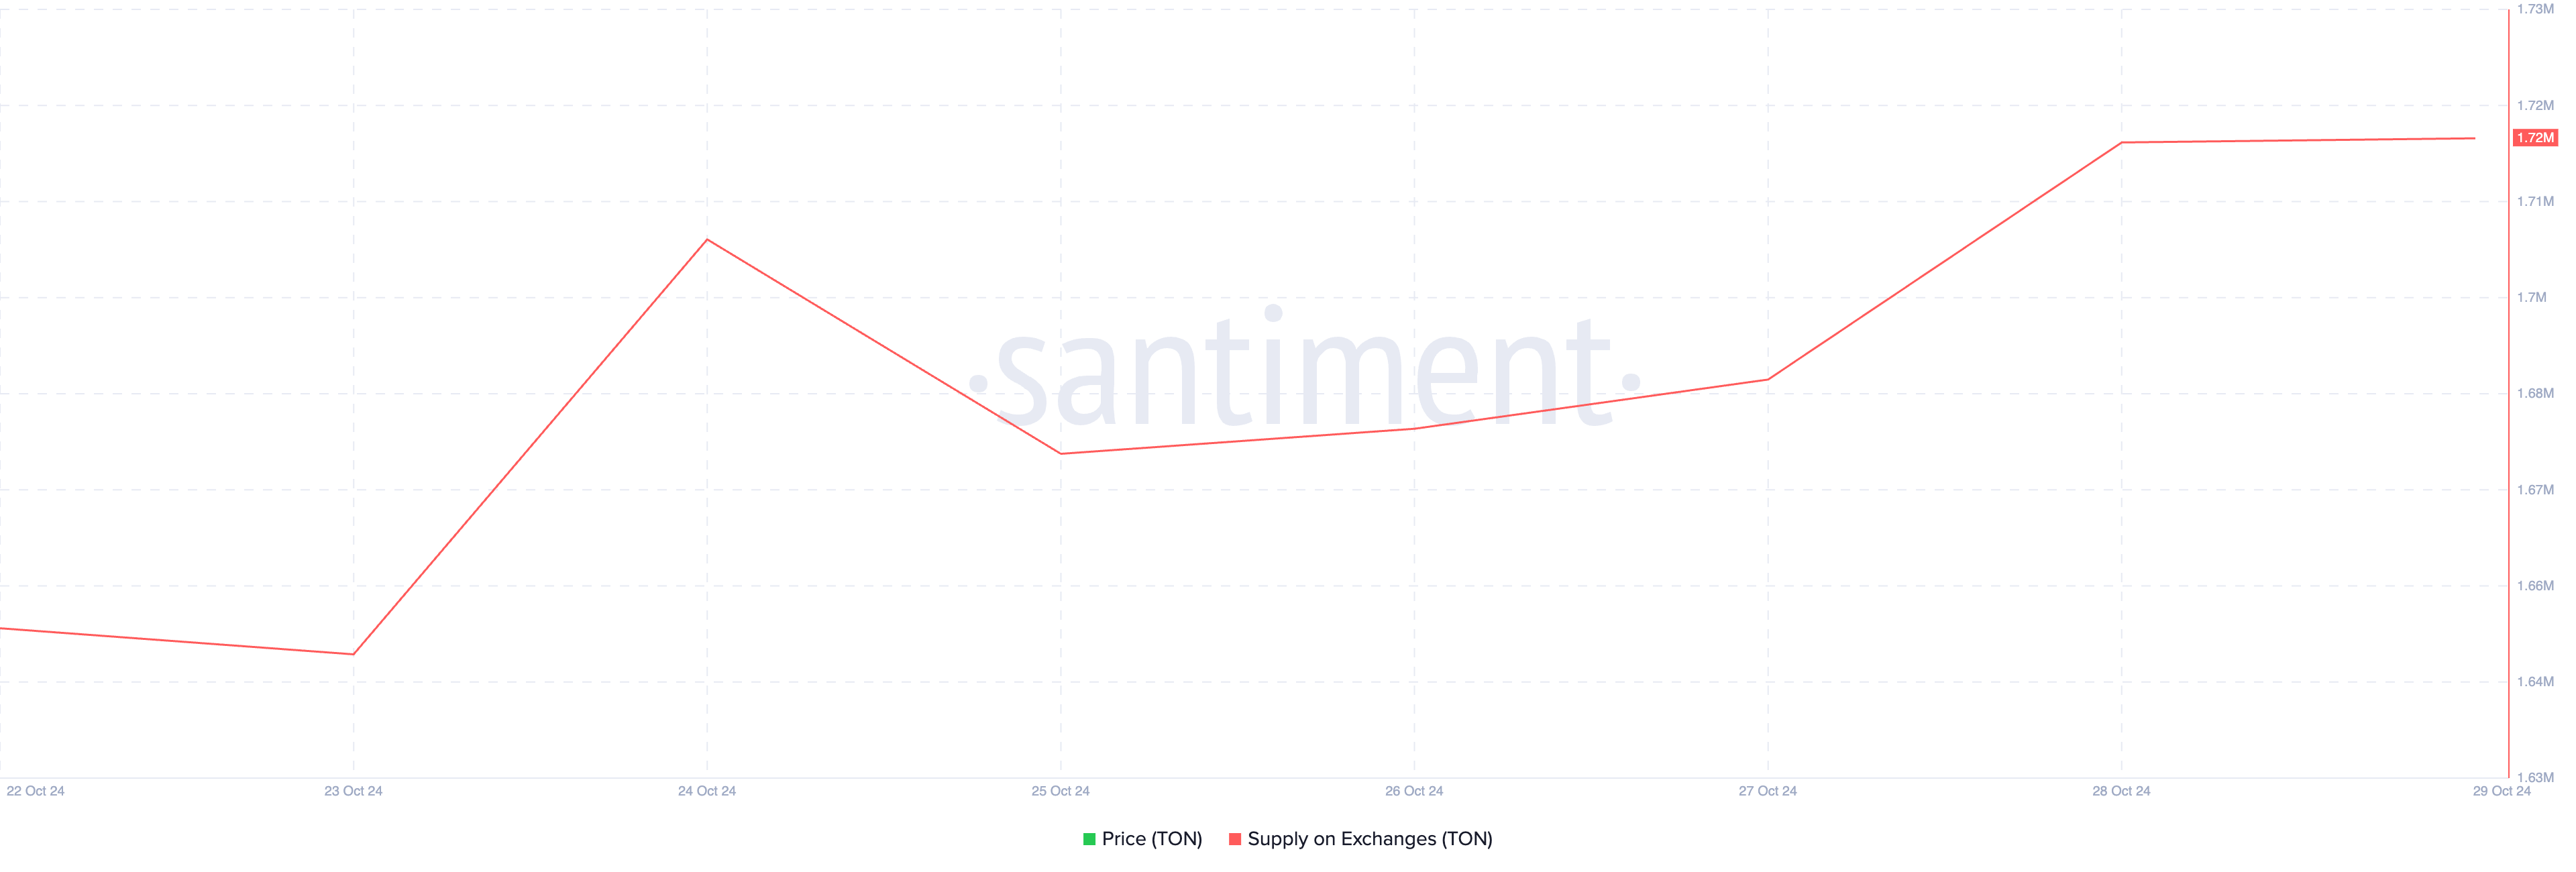
The supply of TON tokens on exchanges has increased to 1.7 million, up from 1.65 million just a week ago. This rise suggests that more TON tokens are being moved onto exchanges, which could be a signal that some holders are preparing to sell.
While the increase isn’t drastic, it is worth monitoring as it may hint at shifting sentiment among holders.

TON Supply on Exchanges. Source: TradingView
Typically, when a coin’s supply on exchanges rises, it is seen as a bearish signal. This is because users generally move their assets to exchanges when they intend to sell, increasing potential selling pressure.
On the contrary, when coins are withdrawn from exchanges, it often reflects bullish sentiment, indicating holders plan to store their tokens long-term, not sell. In this case, the increase in TON supply on exchanges might imply a bearish outlook.
TON Price Prediction: Can TON Stay Around $5?
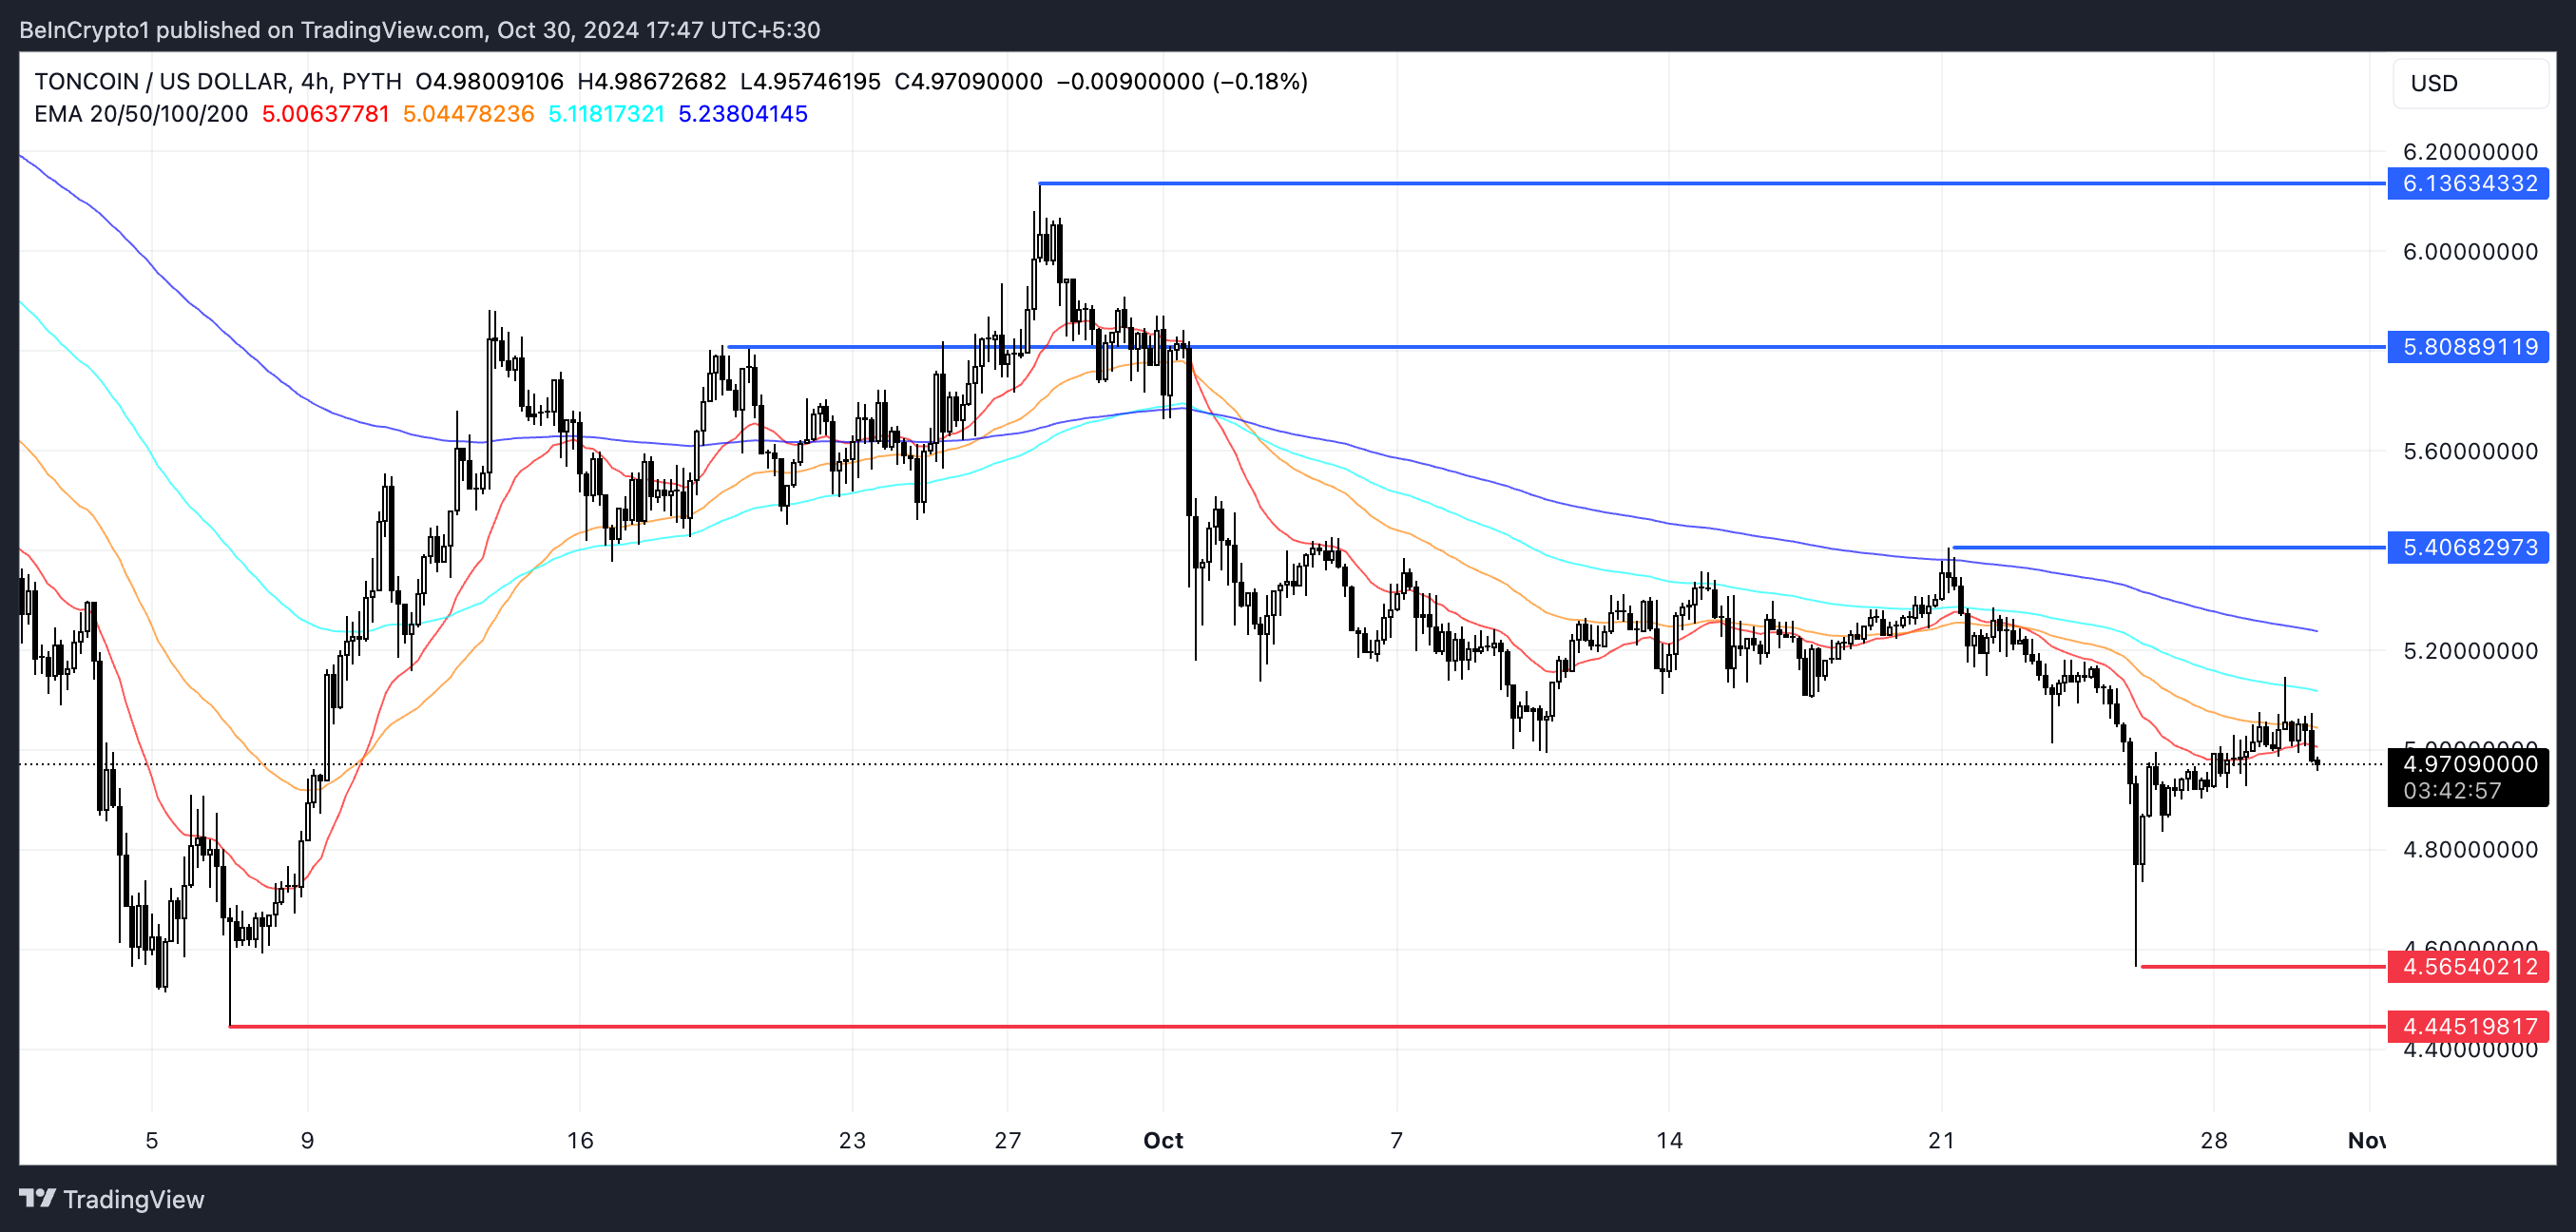
TON’s EMA lines are currently in a bearish configuration, with the long-term EMAs positioned above the short-term EMAs and the price trading below all of them. This setup reflects ongoing bearish sentiment, where the longer-term trends are outpacing the short-term movement, suggesting that downside momentum has been dominant.
However, the distance between these EMA lines is decreasing, implying that bearish momentum may be weakening, which could potentially invite buying pressure in the coming days.
Read more: 6 Best Toncoin (TON) Wallets in 2024

TON EMA Lines and Support and Resistance. Source: TradingView
If the current downtrend persists, TON price faces immediate support at $4.56. Should this level fail, the price could drop as low as $4.44, leading to a possible 10.6% correction. Conversely, if the market reverses, TON may challenge resistance at $5.40 and even $5.80. This could be driven by the number of new users joining the TON blockchain.
Should these resistance levels be broken, the price could surge towards $6.13, representing a potential 23% rise and marking its highest level since late September.
Read the full article here


