Shiba Inu’s (SHIB) rally after a dip has failed for the second time. Cryptocurrency price analysis brought by Coinidol.com.
Shiba Inu price long term forecast: bearish
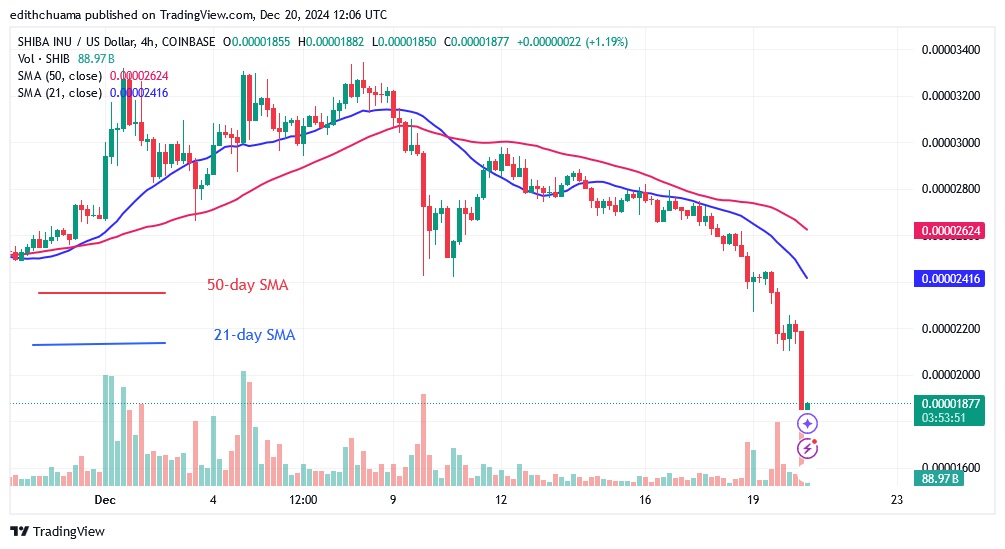
Buyers are struggling to penetrate the highs of $0.00003400 and $0.00003500. On Dec. 4, SHIB rose above the high of $0.00003300 but was unable to sustain the upside momentum. The altcoin was forced into a sideways trend. The cryptocurrency is trading above the 21-day SMA support and below the previous high. On December 9, the bears broke the 21-day SMA support and resumed the selling pressure. Meanwhile, the candlestick body of the Dec. 9 downturn approached the 50% Fibonacci retracement level. The correction predicts that SHIB will fall to the 2.0 level of the Fibonacci extension or $0.00001429. Currently, SHIB has reached a low of $0.00001978.
Shiba Inu indicator analysis
The price bars have fallen drastically below the moving average lines. The altcoin is falling as it approaches the expected price level. The moving average lines are pointing downwards, indicating a downturn. On the 4-hour chart, the moving average lines show a bearish crossover, indicating a negative signal.
Technical indicators
Key resistance levels: $0.00002800, $0.00002900, $0.00003000
Key support levels: $0.00002200, $0.00002000, $0.00001900
What is the next move for Shiba Inu?
On the 4-hour chart, SHIB has dropped considerably and is approaching its previous low of $0.00001800. Price action is characterised by small, indecisive candlesticks, known as dojis. These candlesticks slow down the price movements. The current downward trend is likely to continue to the lower price level.
Disclaimer. This analysis and forecast are the personal opinions of the author. They are not a recommendation to buy or sell cryptocurrency and should not be viewed as an endorsement by CoinIdol.com. Readers should do their research before investing in funds.
Read the full article here


