


 and Filecoin (FIL) Drive the Next Layer 1 Narrative Shift?")


Solana (SOL) is down nearly 13% over the last four days, reflecting a sharp loss of momentum across key technical indicators. The Ichimoku Cloud remains bearish, with price action stuck below a thick resistance zone and short-term lines reinforcing downward pressure.
Meanwhile, SOL’s BBTrend has plunged to -5.68, its lowest level in 11 days, signaling intensified selling activity. With EMA lines still in bearish formation and price struggling to reclaim $150, Solana continues to face strong resistance and uncertain short-term direction.
Bearish Ichimoku Setup Weighs on Solana Price
Solana’s Ichimoku Cloud chart shows a persistently bearish setup. The price action remains below the Kumo (cloud), which has transitioned from red to green in the near future but still indicates overhead resistance.
The blue Tenkan-sen (conversion line) is below the red Kijun-sen (base line), reflecting continued short-term bearish momentum.
Candlesticks are struggling to gain traction above the Tenkan-sen, signaling weak buyer strength and limited upward pressure.
Looking ahead, the cloud itself thickens and flattens, suggesting that even if price attempts a recovery, it will face strong resistance when it approaches the cloud zone.
The leading span lines—Senkou Span A (green) and Senkou Span B (red)—are relatively wide apart, reinforcing uncertainty and low bullish conviction.
The overall trend remains tilted to the downside until price decisively breaks into or above the cloud.
Solana BBTrend Dives Into Bearish Territory
Solana’s BBTrend has sharply dropped to -5.68, marking its lowest reading in the past 11 days.
This decline comes after a brief surge yesterday when the indicator approached the 1.5 zone, hinting at temporary bullish momentum that has since reversed.
The sharp swing into negative territory signals growing weakness and fading buying pressure in the short term.

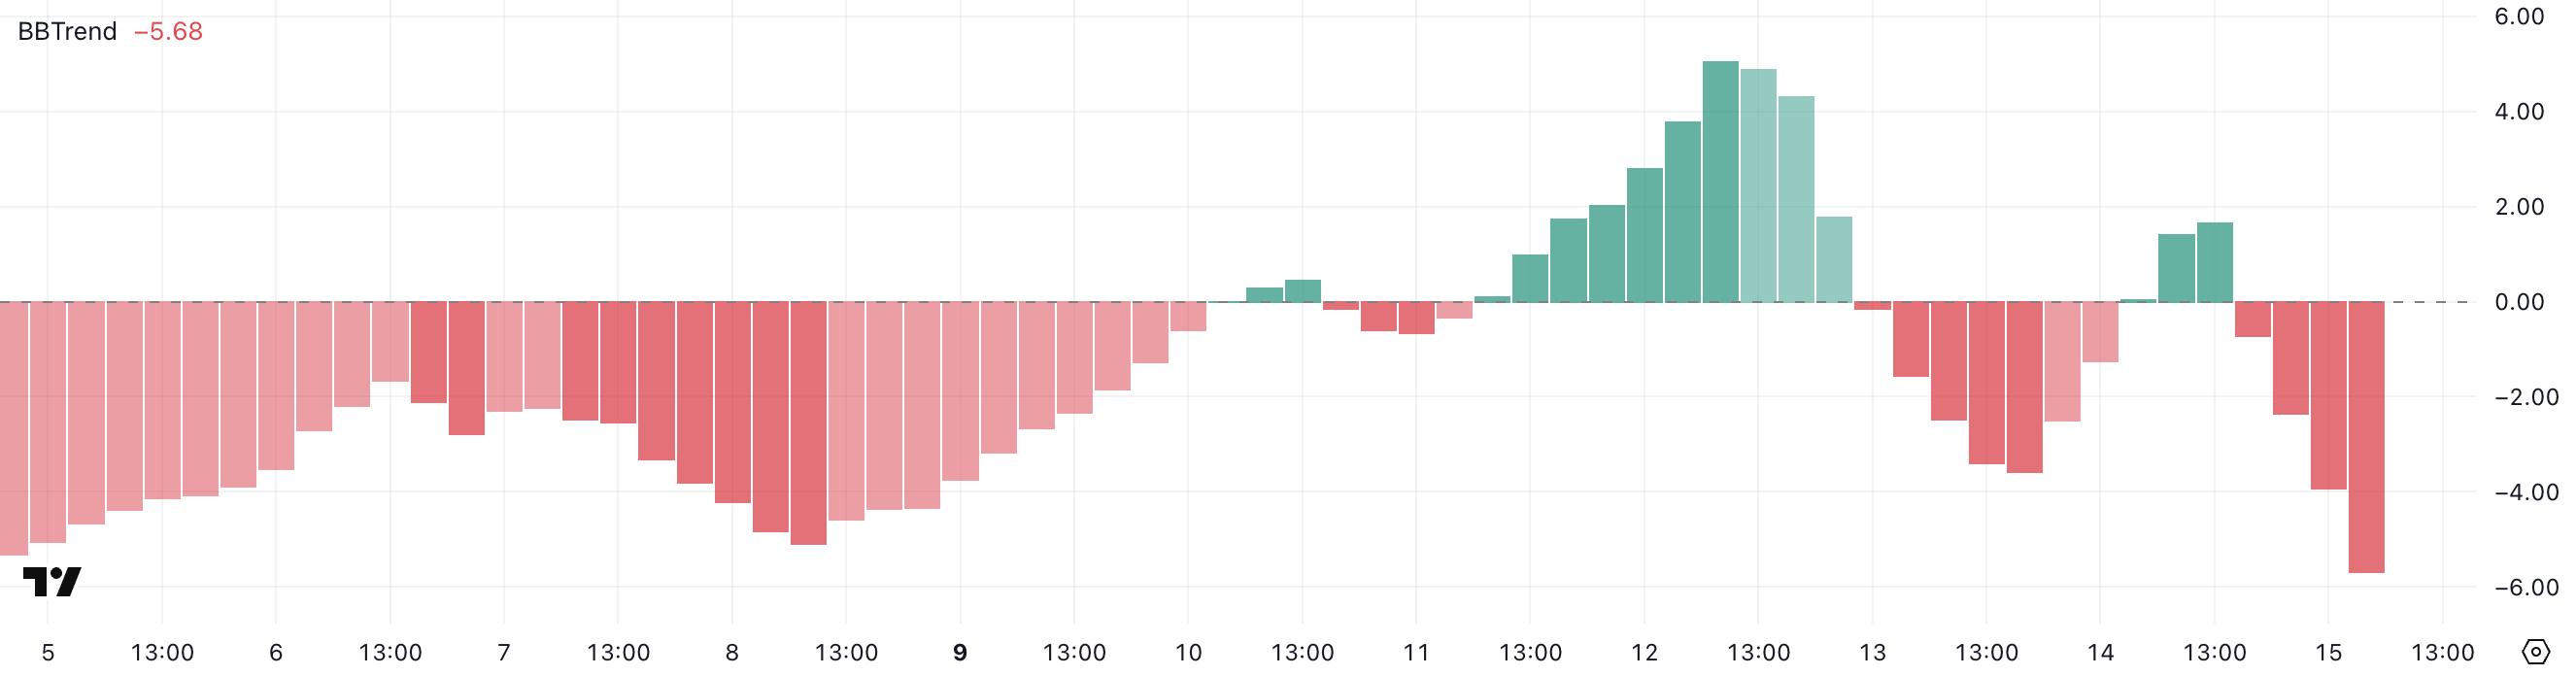
The BBTrend (Bollinger Band Trend) measures the strength and direction of price movements relative to the Bollinger Bands.
Values above 1 suggest a strong uptrend, while readings below -1 indicate a strong downtrend.
A BBTrend of -5.68 places Solana deep in bearish territory, signaling an aggressive downward move and suggesting that volatility is expanding in favor of sellers. If this persists, it could increase the likelihood of further downside pressure in the near term.
SOL Struggles at $150 Resistance After Sharp Drop
Solana’s EMA lines remain in a bearish alignment, with short-term averages still positioned below the long-term ones—confirming a downtrend structure.
Price action has struggled to reclaim the $150 level over the past few days, following a sharp drop of more than 10% triggered by the recent escalation in the Israel-Iran conflict.
This failure to regain momentum reinforces the current weakness in buying pressure.

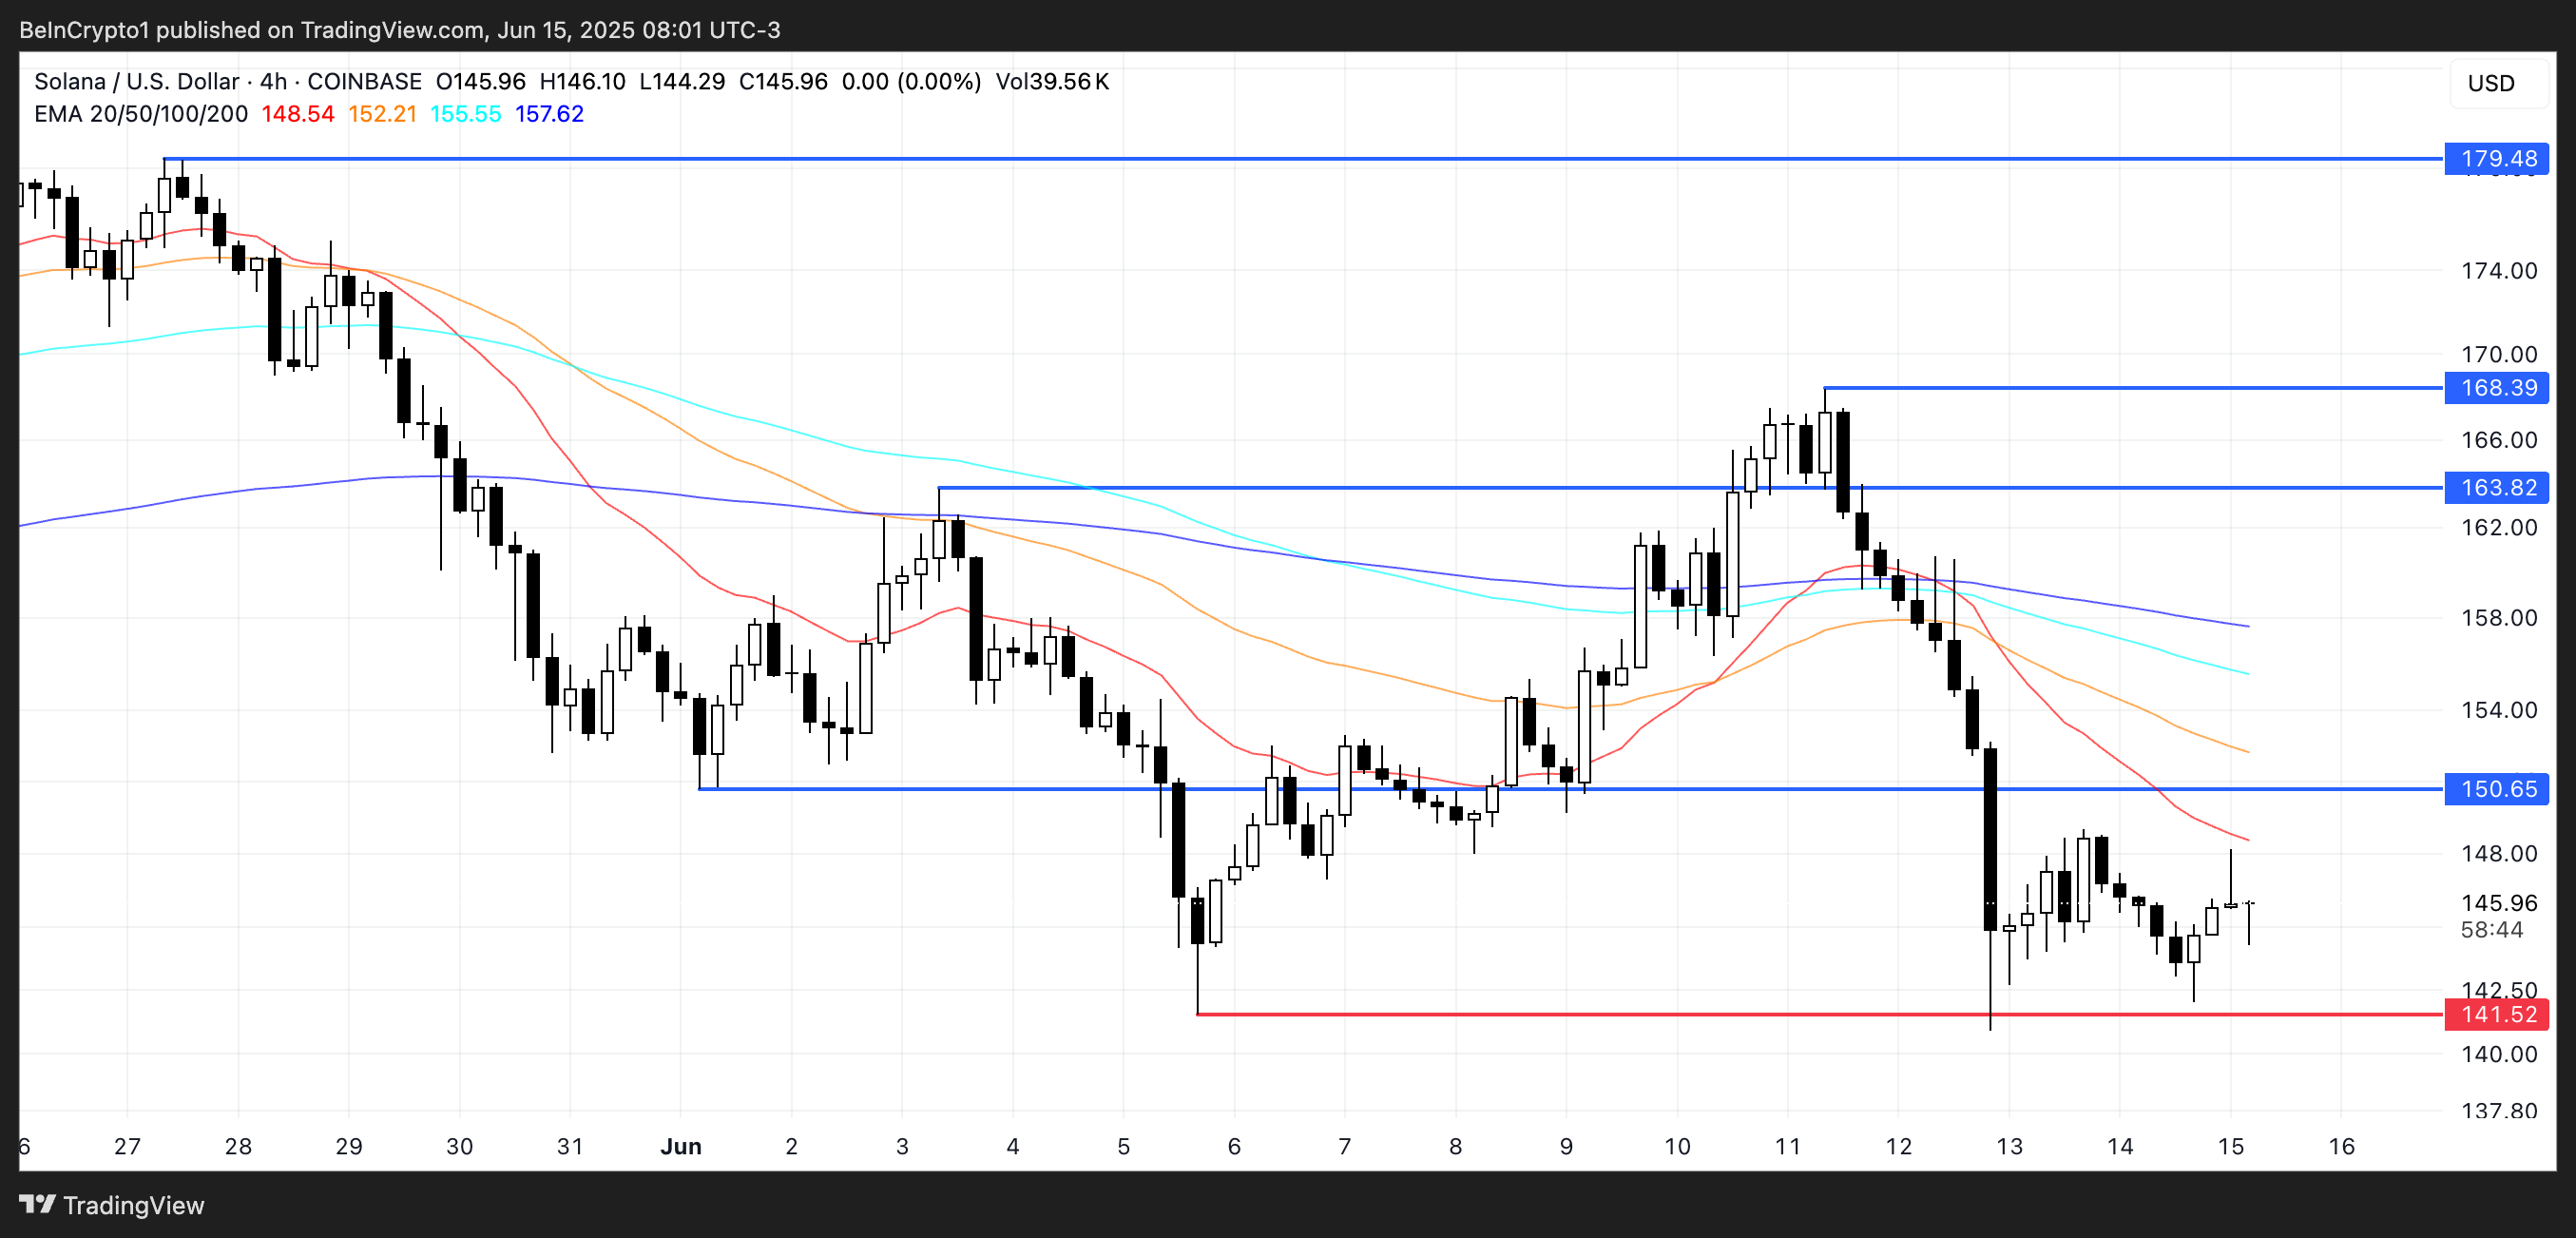
If Solana manages to break through the $150 resistance, it could trigger a recovery toward the $163 and $168 levels, with further upside potential if bullish momentum builds.
However, if the correction resumes, downside pressure may push the price back toward the $141 support zone.
The EMA setup suggests that any rally attempts may face strong resistance until short-term averages start curving upward and crossing over long-term ones.
Disclaimer
In line with the Trust Project guidelines, this price analysis article is for informational purposes only and should not be considered financial or investment advice. BeInCrypto is committed to accurate, unbiased reporting, but market conditions are subject to change without notice. Always conduct your own research and consult with a professional before making any financial decisions. Please note that our Terms and Conditions, Privacy Policy, and Disclaimers have been updated.
Read the full article here


 and Filecoin (FIL) Drive the Next Layer 1 Narrative Shift?")
