Stellar (XLM) price is currently trading around $0.260, hovering just above a key support zone after facing a strong rejection from the 50-day moving average. The recent price action on the daily chart shows a slow bleed over the last few weeks, with XLM price now sitting dangerously close to multiple key demand levels. Short-term sentiment has weakened, as confirmed by the hourly chart, where we recently saw a sharp intraday sell-off that pushed XLM price down nearly 6% in a few hours.
Stellar Price Prediction: How Bad Is the Downtrend on the Daily Chart?
XLM/USD 1 Day Chart- TradingView
The daily Heikin Ashi chart reveals a consistent series of red candles since mid-May. Stellar price has failed to sustain above its 20-day and 50-day SMAs—currently at $0.27112 and $0.28096 respectively. This rejection implies bearish control is still dominant. Moreover, the price has dropped below the 200-day SMA at $0.333, confirming the long-term bearish structure.
We also see Fibonacci extension levels placed below the current price. Assuming the swing high was near $0.30 and swing low near $0.25, the 1.618 extension projects a possible drop to $0.22, which aligns with an old consolidation support level from March.
Calculation:
Let’s assume the swing high was $0.30 and low was $0.25.
1.618 extension = 0.25 – (0.05 × 1.618) ≈ $0.169
However, more conservative Fibonacci supports are seen near $0.24 and $0.22, which are visible as dotted horizontal lines on the chart. This gives us a potential 15%–20% downside risk from current levels.
What Does the Hourly Chart Reveal About Short-Term Sentiment?

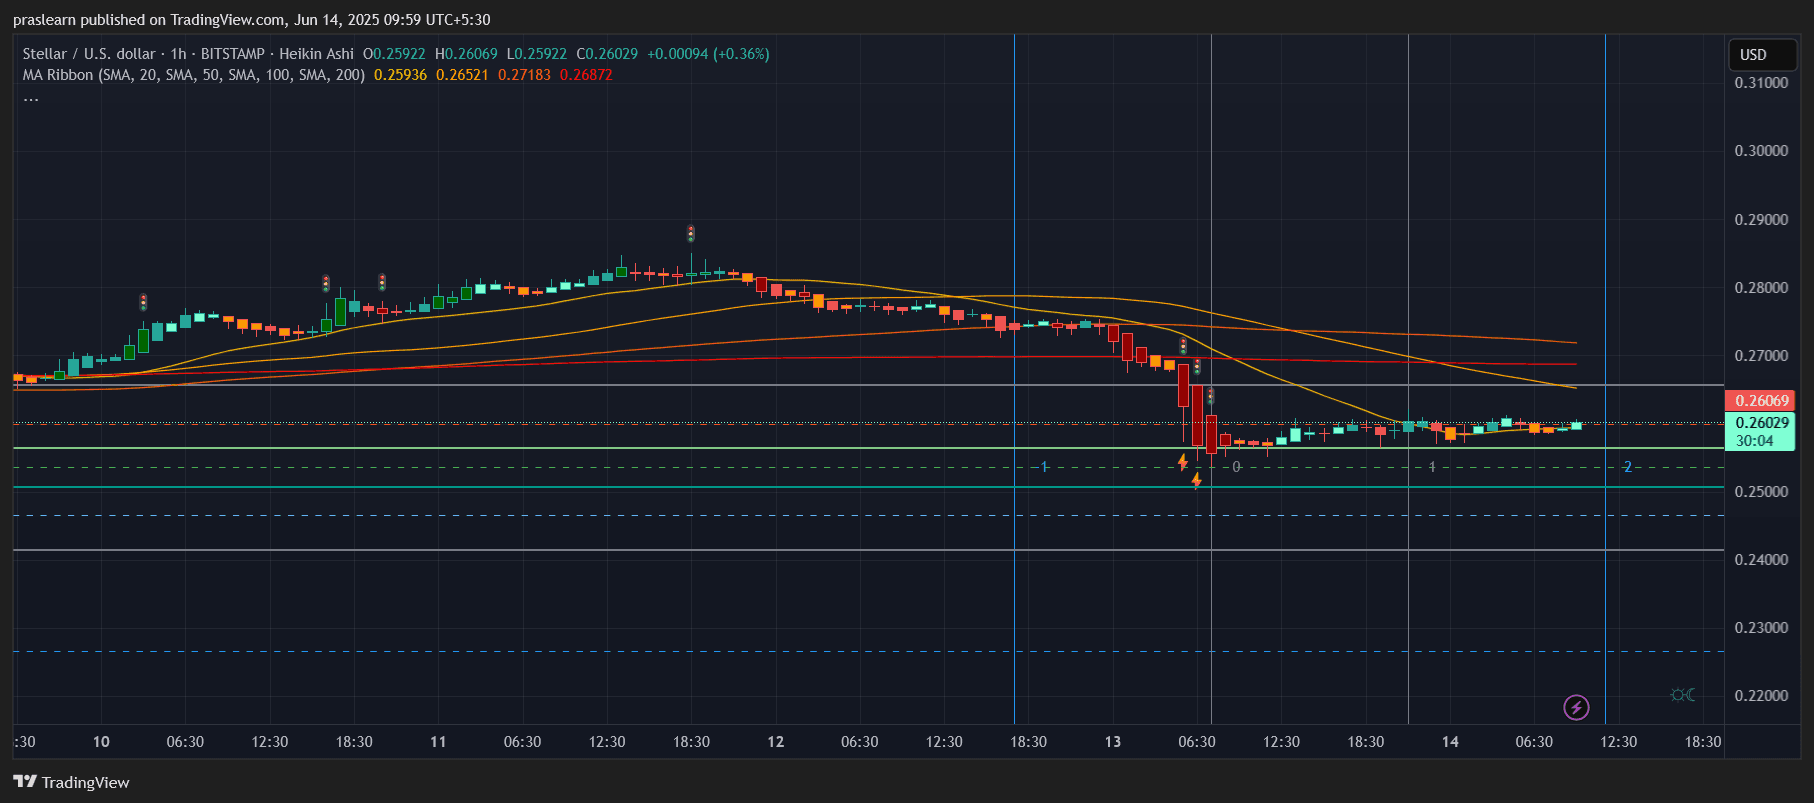
XLM/USD 1 Hr Chart- TradingView
On the hourly chart, XLM suffered a steep fall on June 13, forming a series of large red candles. This wiped out a previous 3-day accumulation range between $0.27 and $0.28. Post-drop, we observe a sideways consolidation around $0.259–$0.260, which suggests price is now searching for support.
Despite the short rebound attempts, the 20, 50, 100, and 200 SMAs are all stacked in bearish order, with the 20-SMA acting as intraday resistance around $0.265. Unless this flips, XLM price could revisit the recent low at $0.254.
The hourly chart also shows attempted accumulation candles, but without increasing volume or bullish divergence, recovery looks weak.
Is There Any Hope for a Reversal?
Reversal chances depend entirely on a decisive break above $0.271—the 50-day SMA. If Stellar price closes a daily candle above this level with volume, we could target $0.30 again. This would be a 15% upside from the current price. However, failure to reclaim this level will likely trigger further selling toward $0.24 and possibly $0.22, where bulls could try a stronger defense.
A simple risk-reward analysis:
Buy at $0.260, stop loss at $0.24 (−7.7%), target $0.30 (+15.4%)
Risk/Reward = 2:1, but only if momentum shifts bullish, which isn’t yet confirmed.
Stellar Price Prediction for June 2025: What’s Next?
If bears maintain control and Bitcoin remains under pressure, XLM price could slide toward the $0.22 zone by the end of June. That would mark a near 15% drop from the current level. On the other hand, any positive macro sentiment or altcoin momentum could push Stellar price to reclaim $0.27 and aim for $0.30, especially if a breakout candle emerges on the daily chart with strong follow-through volume. Right now, the trend is bearish both technically and momentum-wise, with no major bullish reversal signals yet confirmed.
$XLM, $Stellar
Read the full article here


