Bitcoin’s price is yet to break above its recent high and create a new ATH. However, looking at the technical and fundamental signs, it might only be a matter of time.
Bitcoin Price Analysis: Technicals
By TradingRage
The Daily BTC Chart
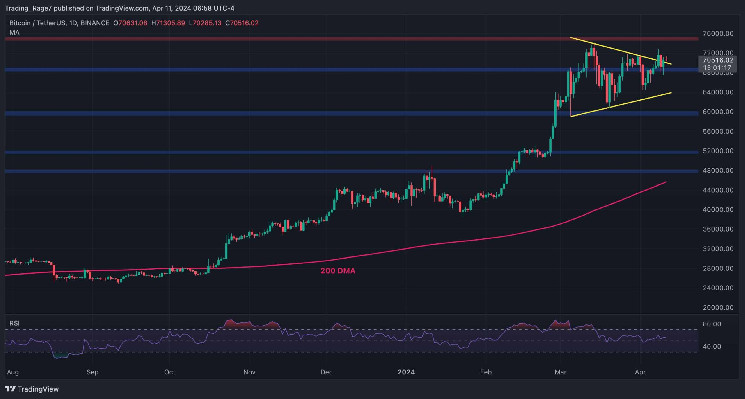
Over the last month, the Bitcoin price has been trapped inside a large symmetrical triangle pattern on the daily timeframe.
Yet, it is currently testing the higher boundary of the pattern, trying to push above the $70K level. If a bullish breakout from the triangle occurs, a positive continuation and, subsequently, a new all-time high would be highly probable.
The 4-Hour BTC Chart
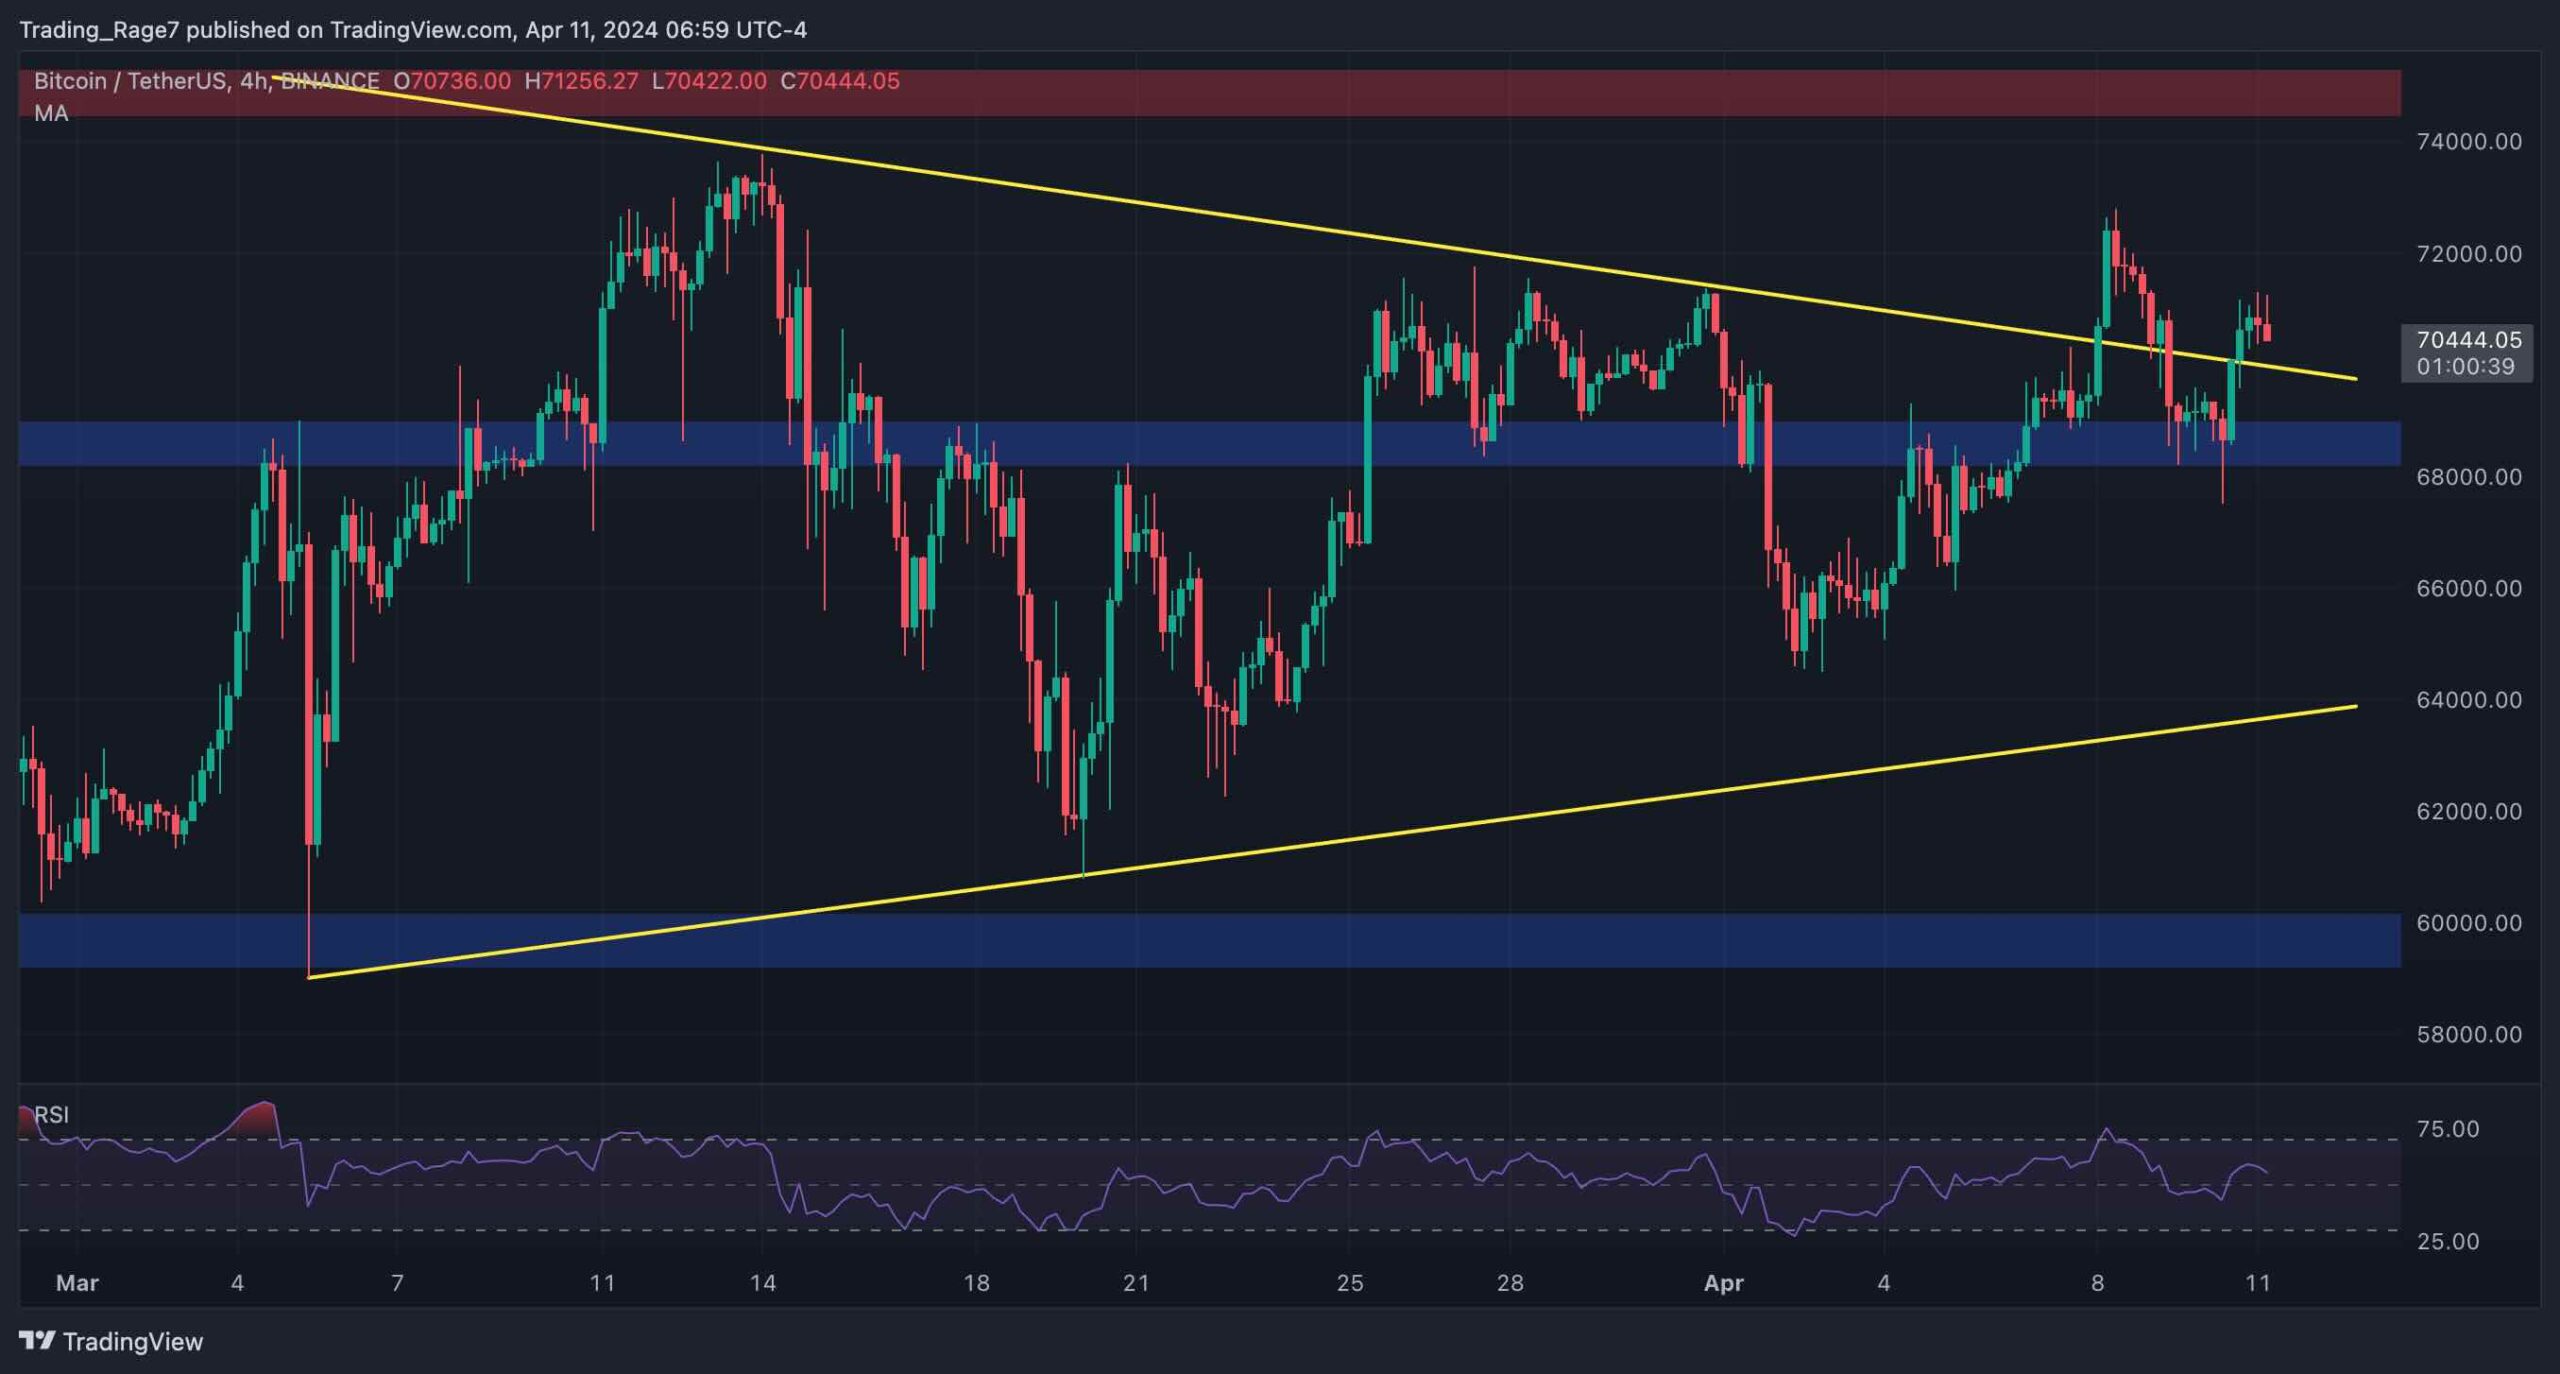
Looking at the 4-hour chart, it is evident that the BTC price has been bouncing around the higher trendline of the triangle and the $70K level recently. Yet, the $68K support zone has seemingly held strong, preventing the price from falling deeper inside the pattern.
Moreover, the Relative Strength Index is showing values above 50%, indicating that the market momentum is bullish at the moment. Therefore, a rally toward the $75K zone and even higher seems likely in the short term if the price does not fall back inside the pattern.

Sentiment Analysis
By TradingRage
Bitcoin Long Liquidations
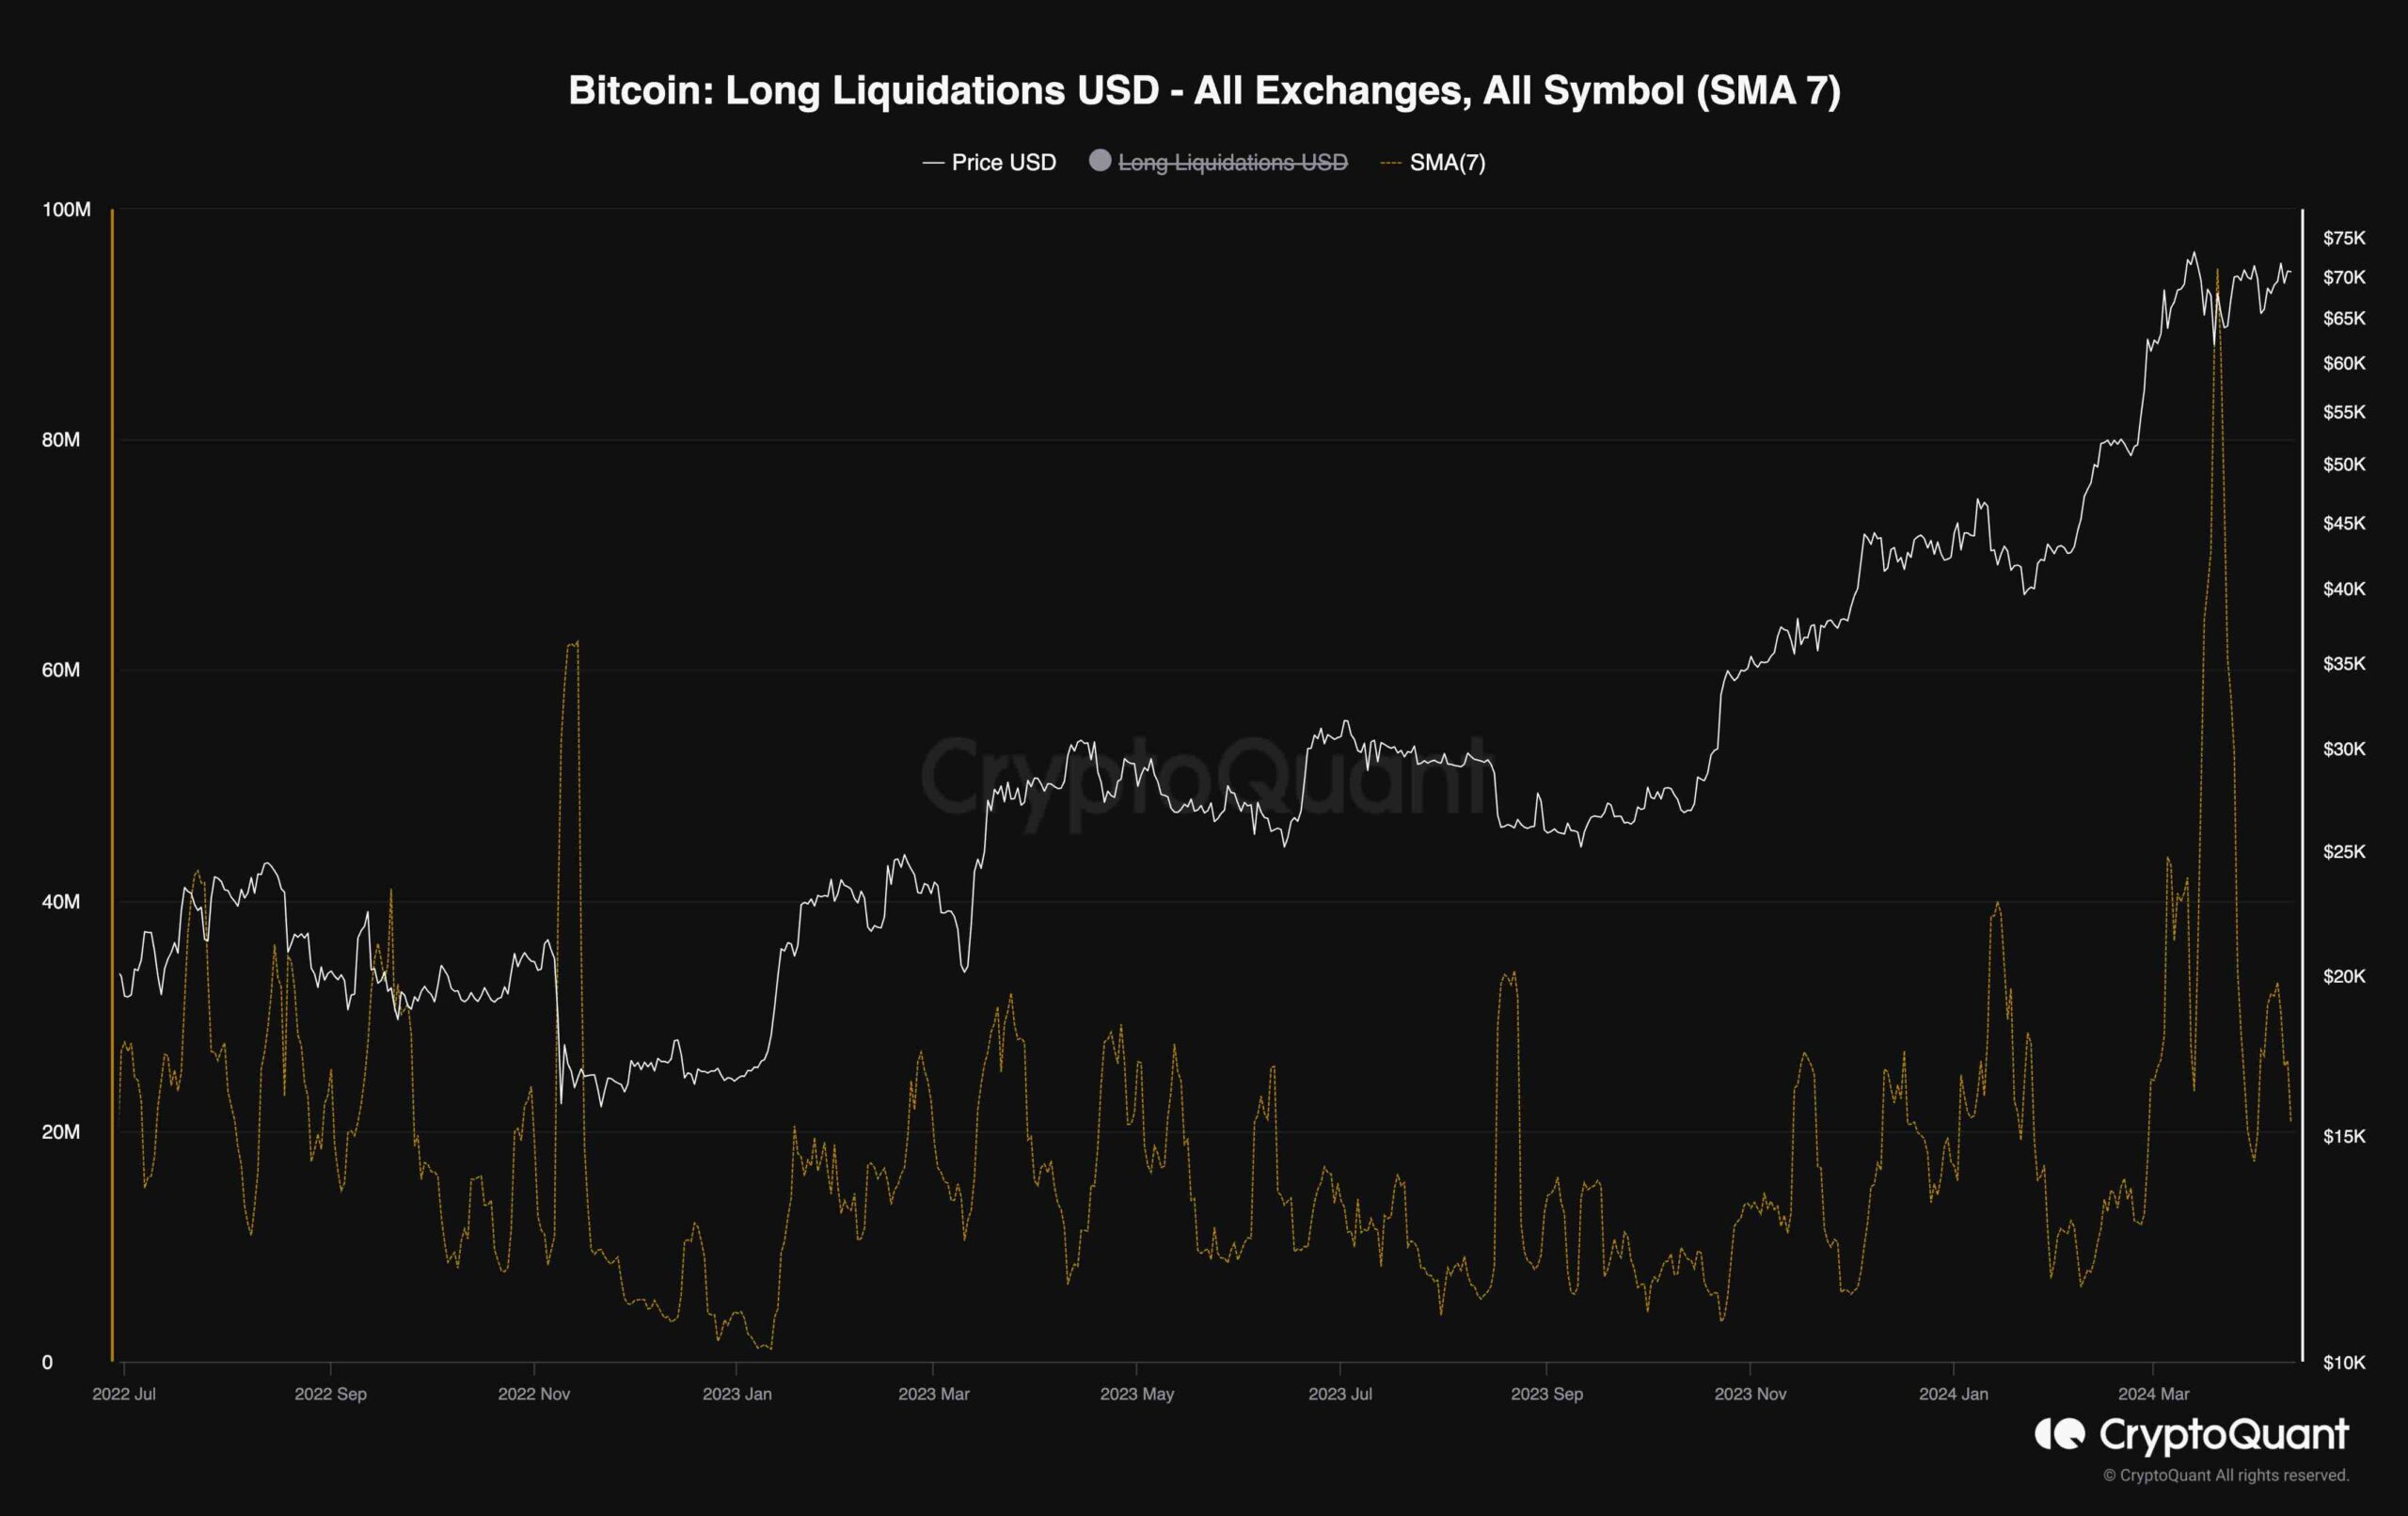
Bitcoin’s recent consolidation around the $70K mark is still going on, with the price showing no willingness to break to either side. Yet, things might be about to change, as the futures market sentiment suggests.
This chart demonstrates the long Bitcoin liquidations. It measures the amount of liquidations of long contracts. As the chart shows, during the recent consolidation, a significant amount of long positions were liquidated. Therefore, the futures market has seemingly cooled down, and BTC might be able to continue its rally soon and make a new all-time high.

Read the full article here


