
 on Cusp of Reclaiming $100K")


Over the past 120 days, TRON coin (TRX) price has jumped 55%, followed by an additional increase of 89% within the last 200 days. The cryptocurrency TRX shows stability across market trends because it gains adoption and grows investor trust.
TRX Performance and Market Trends
TRON’s price value increased recently, but its market position remains 44% lower than its peak all-time high (ATH). The moderate short-term price decline does not affect the upward trend across long-term data.
TRX has endured a 2% price decrease throughout the past month, while the token experienced another 5% deduction over sixty days.
TRON shows a solid recovery through its 90-day return at 20%, 120-day return at 55%, and 200-day return at 89%.
Analysis indicates that TRON will continue its long-term expansion trajectory according to price data, notwithstanding current temporary fluctuation patterns.
The market capitalization of TRON demonstrates patterns identical to those of its price movements. The TRX market capitalization experienced a 2.48% loss during the previous 30-day period and decreased by 5.48% between 60 days.
During the initial 90 days, the price rose by 19.8% and increased by 53.9% within 120 days. It reached 86.9% growth in 200 days. TRON demonstrates strength through this market recovery, proving its ability to stay liquid while drawing investment funding during periods of macroeconomic doubt.
The current price of TRX is 44% below its all-time high, creating chances for growth as bullish momentum keeps building.
Dramatic price growth from the ATL level reveals that TRX has maintained its upward trend since the beginning and consistently tolerates market downturns.
TRX Performance Data Chart | Source: CryptoQuant
Tron Coin Technical Analysis and Market Outlook
The initial graph displays historical data on TRON’s price movement. This demonstrates consistent growth with regular fluctuations. Significant influxes of liquidity have caused TRX to become particularly volatile.
The price line for TRX shows gradual upward movement along with distinct peaks that form when price rises occur with high trading volumes. The 120-day and 200-day price returns back up the optimistic assumptions through substantial value growth.
TRX/USDT data from the OKX exchange is presented in the second chart using a real-time technical assessment for traders. A single-hour chart displaying candlesticks shows important support areas along with resistance points.
The red resistance area at $0.246 demonstrates the selling force against TRX as traders sold their assets upon hitting this price point, leading to a price decline. Tron coin maintains positions above essential support zones after falling from its upper channel position. This indicates that it may try again to exceed current resistance levels.
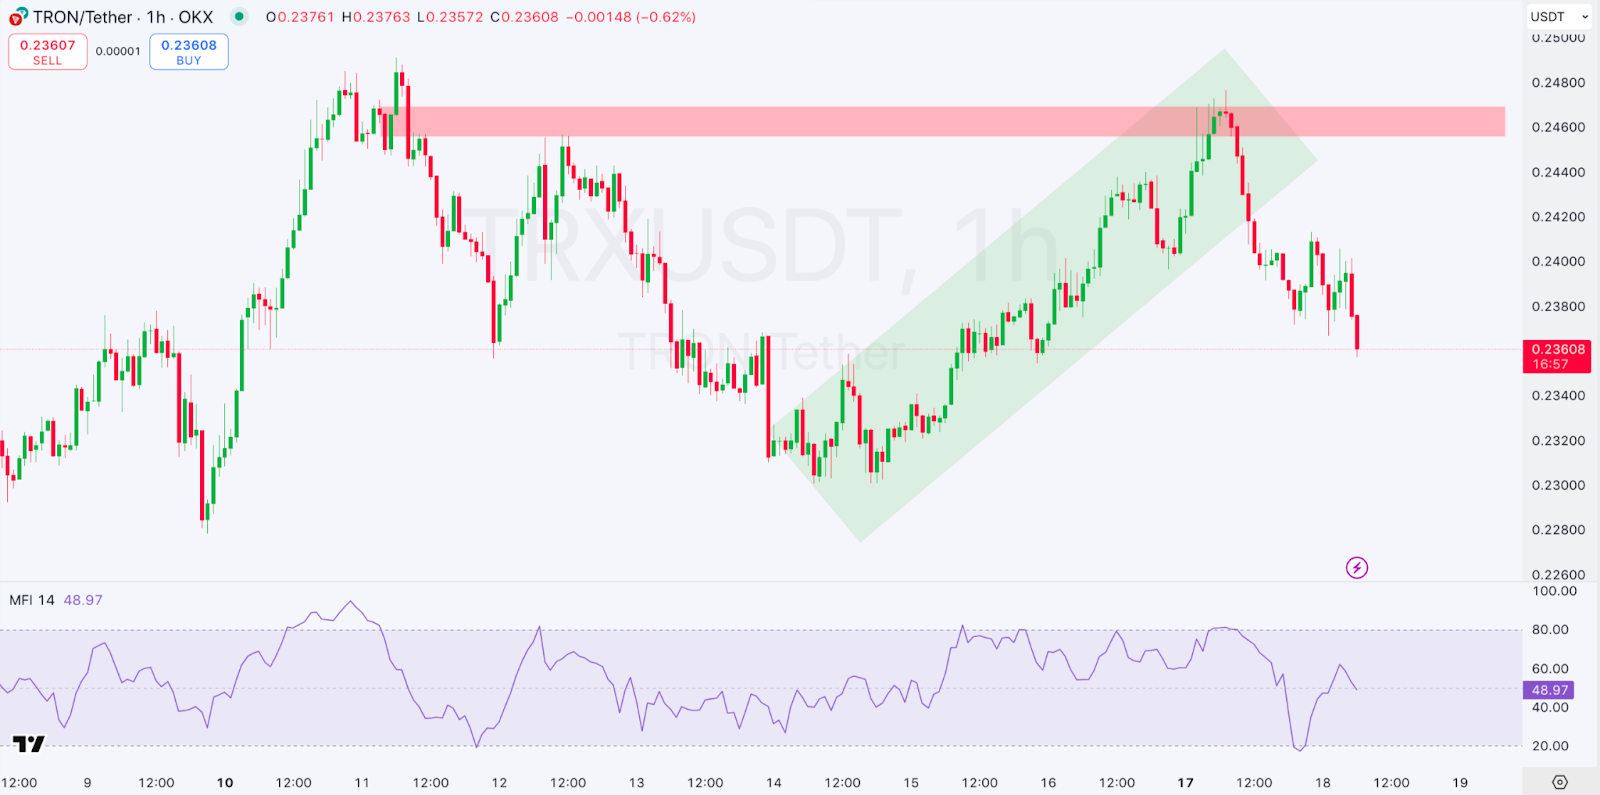
1-hour TRX/USDT Chart | Source: TradingView
The Money Flow Index stands at 48.97, showing an unbiased market condition between purchasing and selling forces. The price level exceeding 50 demonstrates purchasing strength but shows increasing signs of sellers taking over when they are below 50.
TRX maintains a position that prevents it from being overbought or oversold, so the price may cling to its current values until it executes its next apparent directional movement.
The green ascending channel showcases a wide bull pattern that faced brief disruptions after price contact with resisting boundaries.
TRX will start another growth phase after it breaks past the resistance zone at $0.246 and pushes toward higher prices. If Tron coin cannot maintain upward movement, the price has the potential to drop below $0.234, but resistance might be encountered at this level.
Read the full article here


 Dodge Death Cross? XRP Paints Secret But Major Pattern, Dogecoin (DOGE) Might Surprise You")
