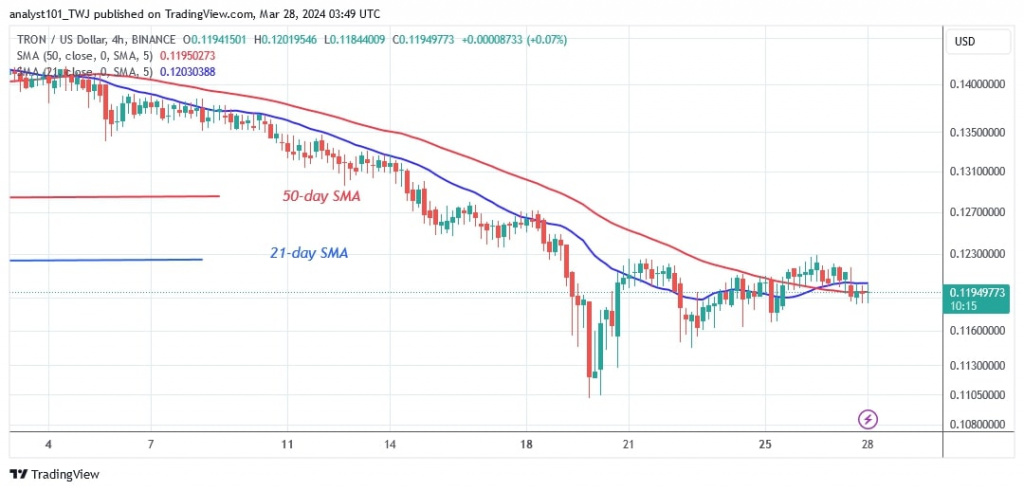
TRON’s (TRX) price is still falling below the moving average lines. Price analysis by Coinidol.com.
Long-term forecast for TRON’s price: bearish
After the recent slide above the support level of $0.11, the altcoin has started to move in a range between $0.11 and $0.13. TRON rebounded in the previous price action after bouncing off a high of $0.144. Buyers were unable to sustain the positive momentum above the overhead resistance of $0.148. The overhead resistance is the historical price level from May 10, 2021.
If the bulls break through the overhead barrier, the altcoin will return to the bull market. TRON will rise above the $0.15 high. The value of the altcoin now stands at $0.1193. It is currently trading in a range of $0.11 to $0.13, waiting for a trend to emerge.
TRON indicator reading
After the current price slump, the TRON price bars have fallen below the moving average lines. TRON is oscillating in a limited range, with doji candlesticks dominating the price action. Doji candlesticks indicate traders’ indifference to the market direction.
Technical Indicators
Key supply zones: $0.09, $0.10, $0.11
Key demand zones: $0.06, $0.05, $0.04
What is the next direction for TRON?
TRON has reached a bearish exhaustion while trading in a range. The cryptocurrency is moving within a limited price range of $0.11 to $0.13. The presence of doji candlesticks has caused the price action to remain stationary. TRON will resume a positive trend if the buyers sustain the price above the moving average lines or the $0.13 resistance level.

Disclaimer. This analysis and forecast are the personal opinions of the author and are not a recommendation to buy or sell cryptocurrency and should not be viewed as an endorsement by CoinIdol.com. Readers should do their research before investing in funds.
Read the full article here

