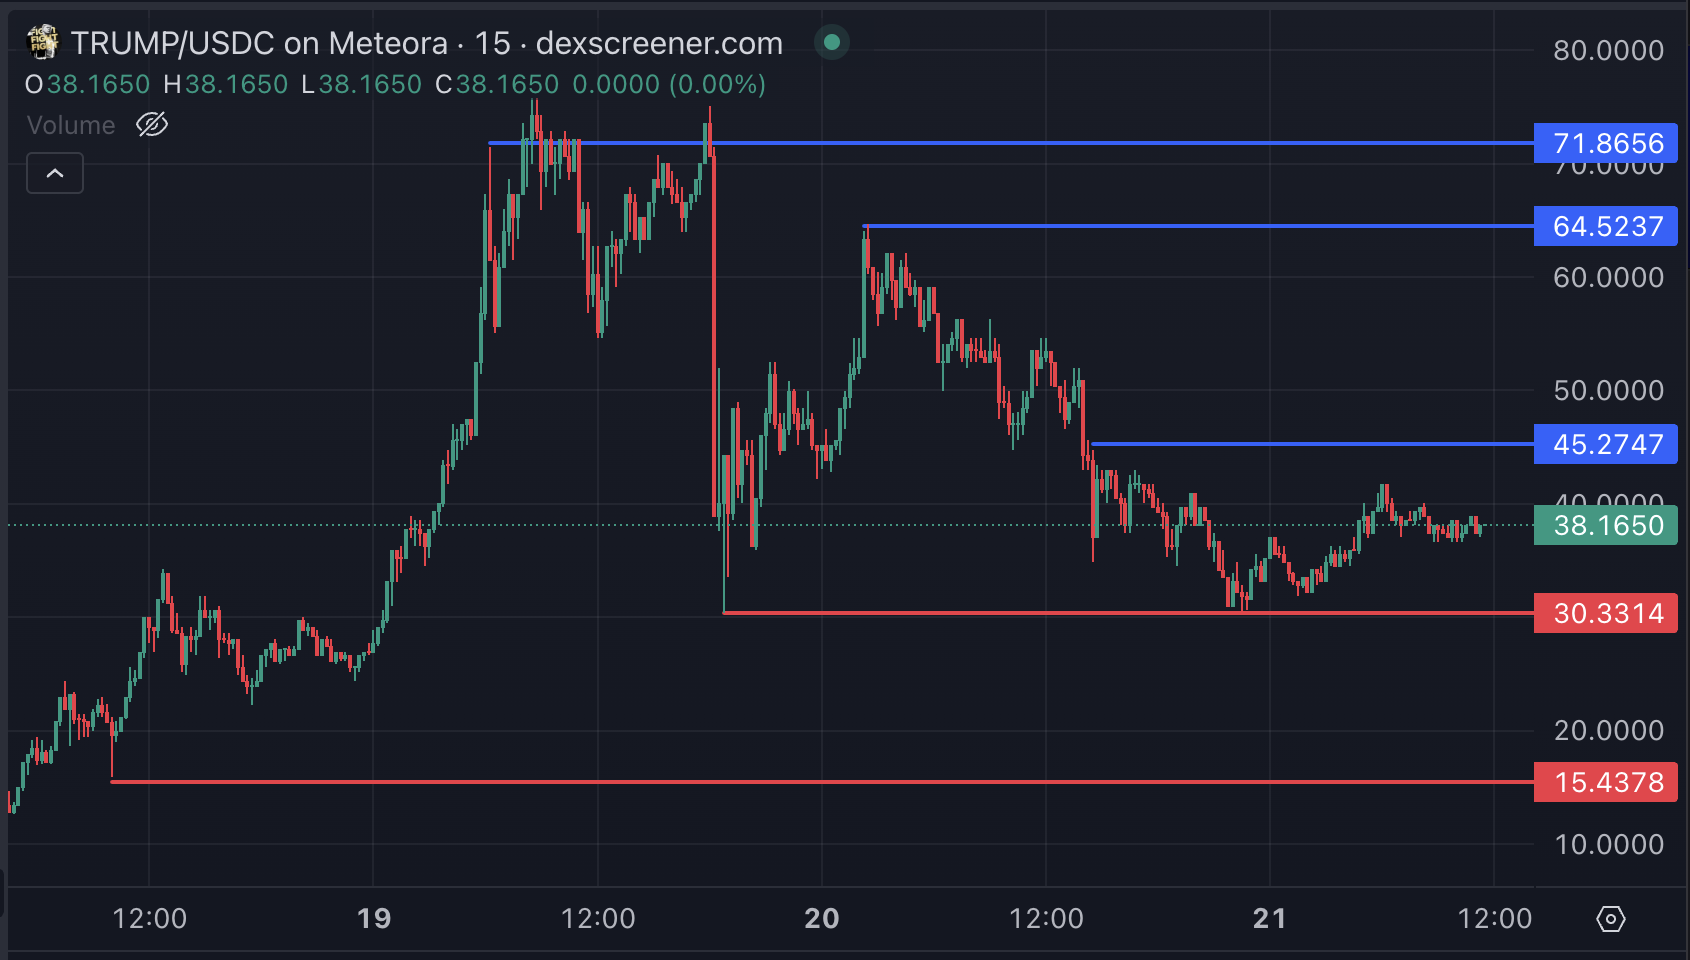
TRUMP price has plunged over 27% in the last 24 hours, with its market cap now at $7.5 billion, down from nearly $15 billion just two days ago. This sharp decline comes amid heightened volatility, as the coin trades within a consolidation range between $30.3 support and $45 resistance.
While technical indicators like RSI and ADX suggest neutral momentum and a lack of clear trend, the potential for a significant breakout or breakdown remains high. If TRUMP recovers its uptrend, it could aim for an 88% upside to $71.8, but losing key support at $30.3 could lead to a steep correction toward $15.43.
TRUMP RSI Is Currently Neutral
TRUMP RSI currently stands at 46.8, rising sharply from 30 just yesterday, signaling a swift recovery from oversold conditions, after touching 67 a few hours ago.
The movement toward the 50 level indicates momentum is neutral, but the token’s position still suggests caution as it remains below the threshold for a clear bullish trend.
TRUMP RSI. Source: Dexscreener.
The Relative Strength Index (RSI) is a technical indicator used to measure the speed and magnitude of price movements to evaluate market momentum. It ranges from 0 to 100, with values above 70 indicating overbought conditions, often preceding a price correction, and values below 30 signaling oversold conditions, which can suggest a potential recovery.
At 46.8, TRUMP RSI reflects a neutral stage, indicating the potential for price stabilization or gradual growth. However, the token needs to break above 50 to signal stronger bullish momentum and reinforce confidence in a sustained upward trend.
TRUMP ADX Shows An Undefined Trend
TRUMP ADX is currently at 14.4, dropping significantly from 46 just yesterday. This sharp decline indicates a substantial weakening in trend strength, as the coin moves sideways without a clear directional bias.
The low ADX level suggests that TRUMP is experiencing reduced volatility and indecisive market behavior in the short term.

TRUMP ADX. Source: Dexscreener.
The Average Directional Index (ADX) measures the strength of a trend, regardless of its direction, on a scale from 0 to 100. Readings above 25 typically signify a strong trend, while values below 20 indicate a weak or nonexistent trend. With TRUMP ADX at 14.4, the token’s price movement is currently directionless, reflecting a consolidation phase.
This sideways action could either precede a breakout as momentum rebuilds or extend further if traders remain hesitant to commit to a definitive trend.
TRUMP Price Prediction: Will TRUMP Further Correct By 59%?
TRUMP is currently trading in a range defined by resistance at $45 and support at $30.30, reflecting a period of consolidation. If the token regains its uptrend and positive momentum, it could test the $45 resistance level.
A breakout above this level could open the door for a rally to $64.50, and further strength might propel TRUMP to $71.80, representing a potential upside of 88% from current levels and making it one of the top 3 meme coins in the market.

TRUMP Price Analysis. Source: Dexscreener.
Conversely, if TRUMP price tests the $30.30 support and fails to hold above it, the price could face a steep correction. Breaking below this support might drive the token down to $15.43, representing a potential 59% decline.
Read the full article here


