


TRUMP price has continued its downward trajectory, currently trading near $21 after a sharp decline of roughly 72% from its all-time high. Over the past 24 hours, the meme coin has dropped another 9%, extending its losses to nearly 30% in a week.
TRUMP lost nearly $10 billion in market cap over the past two weeks, reflecting ongoing selling pressure. As technical indicators like RSI and CMF remain weak, the meme coin faces a critical test to determine whether it can regain momentum or risk further downside.
TRUMP RSI Shows Sellers Are Still In Control Despite The Recent Recovery
TRUMP RSI is currently at 31.68, remaining below the 50 mark for the past seven days, with a notable low of 19.8 on February 1. This extended period of weak RSI suggests persistent selling pressure, as the token has struggled to generate enough momentum for a meaningful recovery.
A sharp dip to 19.8 highlights an extreme level of bearish sentiment, though the recent recovery to 31.68 indicates some stabilization. However, the inability to cross 50 suggests that bullish strength remains limited, keeping TRUMP in a vulnerable position.
TRUMP RSI. Source: TradingView.
The Relative Strength Index (RSI) is a momentum oscillator that measures the speed and magnitude of price movements, ranging from 0 to 100.
Readings above 70 indicate overbought conditions, signaling a possible correction, while readings below 30 suggest an asset is oversold and may be primed for a rebound.
With TRUMP RSI at 31.68, it is hovering just above oversold territory but still below the neutral 50 level, indicating that sellers continue to dominate.
The inability to reclaim 50 over the past week reinforces a bearish outlook, as it reflects a lack of sustained buying pressure necessary to shift market sentiment.
CMF Is Currently At Very Low Levels
TRUMP CMF is currently at -0.23, marking its third consecutive day in negative territory. Yesterday, it hit an all-time low of -0.27, reflecting a significant outflow of capital.
This sustained negative reading suggests that selling pressure has outweighed buying interest, with more volume being transacted at lower prices.
While the slight recovery to -0.23 indicates some stabilization, the overall trend remains bearish, signaling that TRUMP is struggling to attract consistent liquidity inflows.


TRUMP CMF. Source: TradingView.
The Chaikin Money Flow (CMF) is an indicator that measures the accumulation and distribution of capital based on price and volume over a specified period. It ranges from -1 to 1, with positive values indicating strong buying pressure and negative values suggesting persistent selling pressure.
A CMF reading of -0.23 means that sellers are in control, as more volume is flowing out of TRUMP than into it. Given that CMF has remained negative for three days and recently hit its lowest level ever, this suggests weak demand and a lack of sustained buying support, which could keep TRUMP price under pressure in the short term.
TRUMP Price Prediction: More Corrections Ahead?
The TRUMP meme coin is currently trading near the $21 level, facing a key resistance at $24.58. As one of the most hyped meme coins ever launched, a resurgence in momentum could drive a breakout above this resistance.
If buying pressure strengthens and TRUMP reclaims bullish momentum, testing $24.58 becomes a likely scenario.
A successful breakout above this level could trigger further upside, potentially leading to a test of $30.47 in the near term as traders capitalize on renewed enthusiasm.

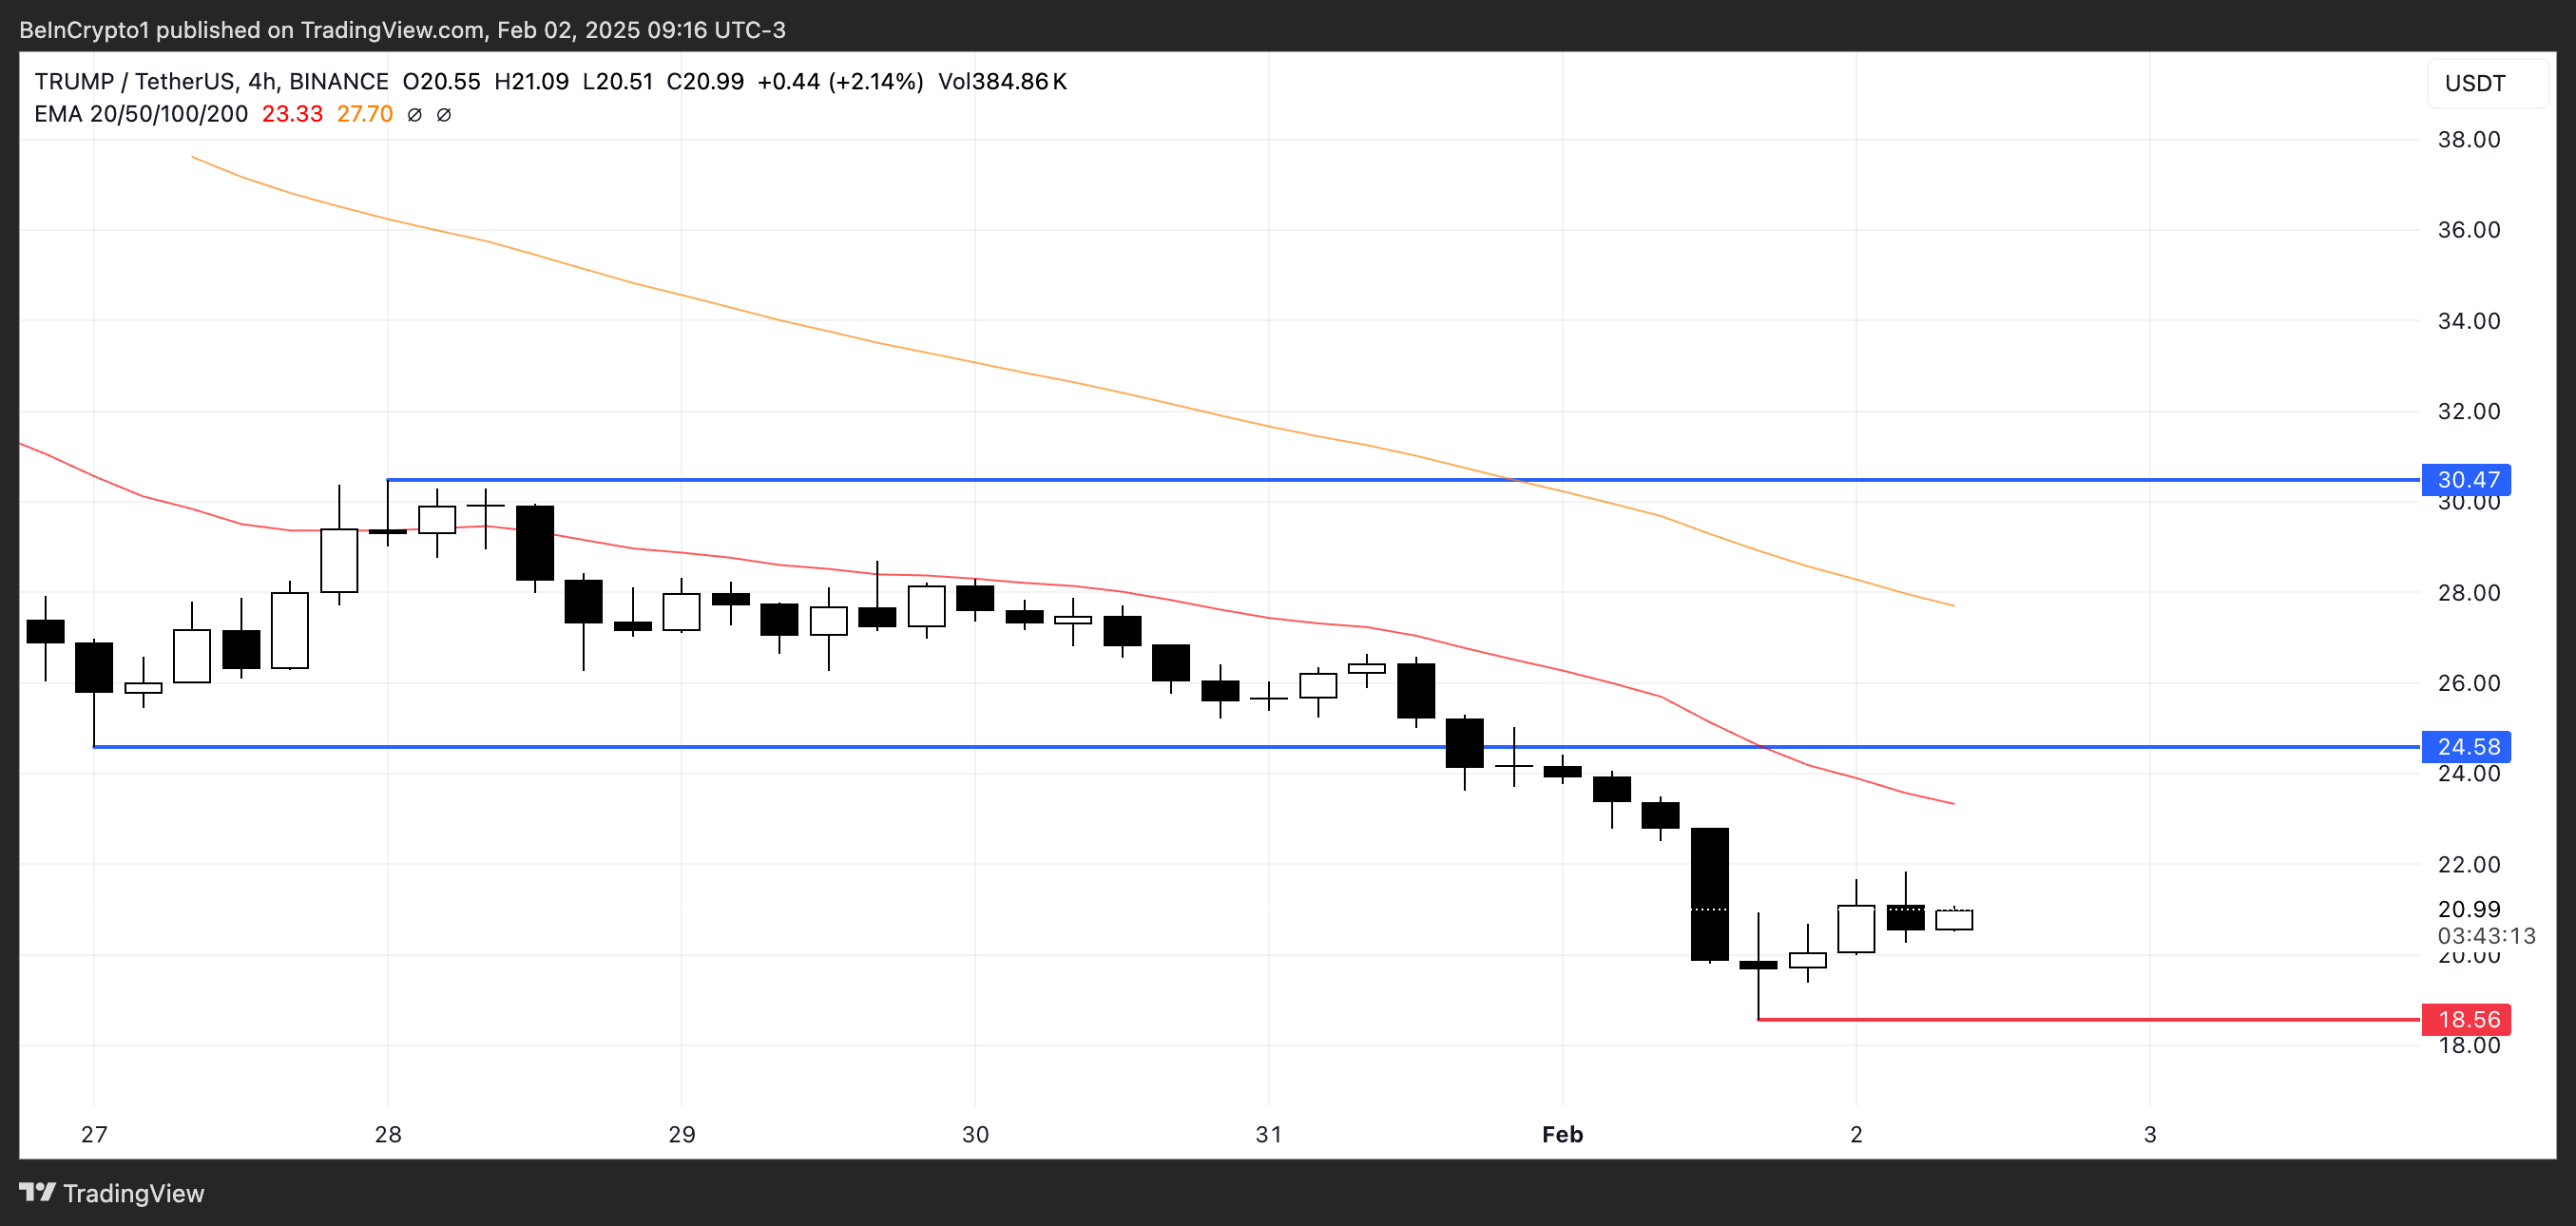
TRUMP Price Analysis. Source: TradingView.
On the other hand, if TRUMP price fails to establish an uptrend and sellers maintain control, downward pressure could intensify. A lack of buying strength might push the price lower, with $18.56 acting as the next major support level.
If bearish sentiment deepens and volume favors sellers, TRUMP price could break below this level, opening the possibility for further downside.
Read the full article here


