The Net Unrealized Profit/Loss (NUPL) chart for Bitcoin provided a vivid portrayal of investor sentiment and market phases.
As of press time, Bitcoin had re-entered the ‘Belief’ stage. It is a phase characterized by returning confidence and long-term holding as prices rise significantly above the last major peak.
The stage is usually followed by the ‘Optimism’ phase and preceded by ‘Euphoria.’ It indicates a strong, continuing belief in Bitcoin’s potential for higher valuations.
– Advertisement –
The progression into ‘Belief’ is notable because it suggested a majority of holders are in profit but are not yet compelled to sell, betting on further price increases.
The position of the NUPL line moving solidly into the green zone supported this interpretation, reflecting a healthy market optimism. However, the exact duration of this phase remains uncertain.
Historically, the transition from ‘Belief’ to ‘Euphoria’ has varied significantly, depending on broader market conditions, investor sentiment, and macroeconomic factors.
While there is room for growth, the market’s next move is ambiguous. Monitoring the NUPL for signs of shifting sentiment that may precede a new phase, potentially heralding the peak of the current cycle is crucial.
Long Liquidations Incoming
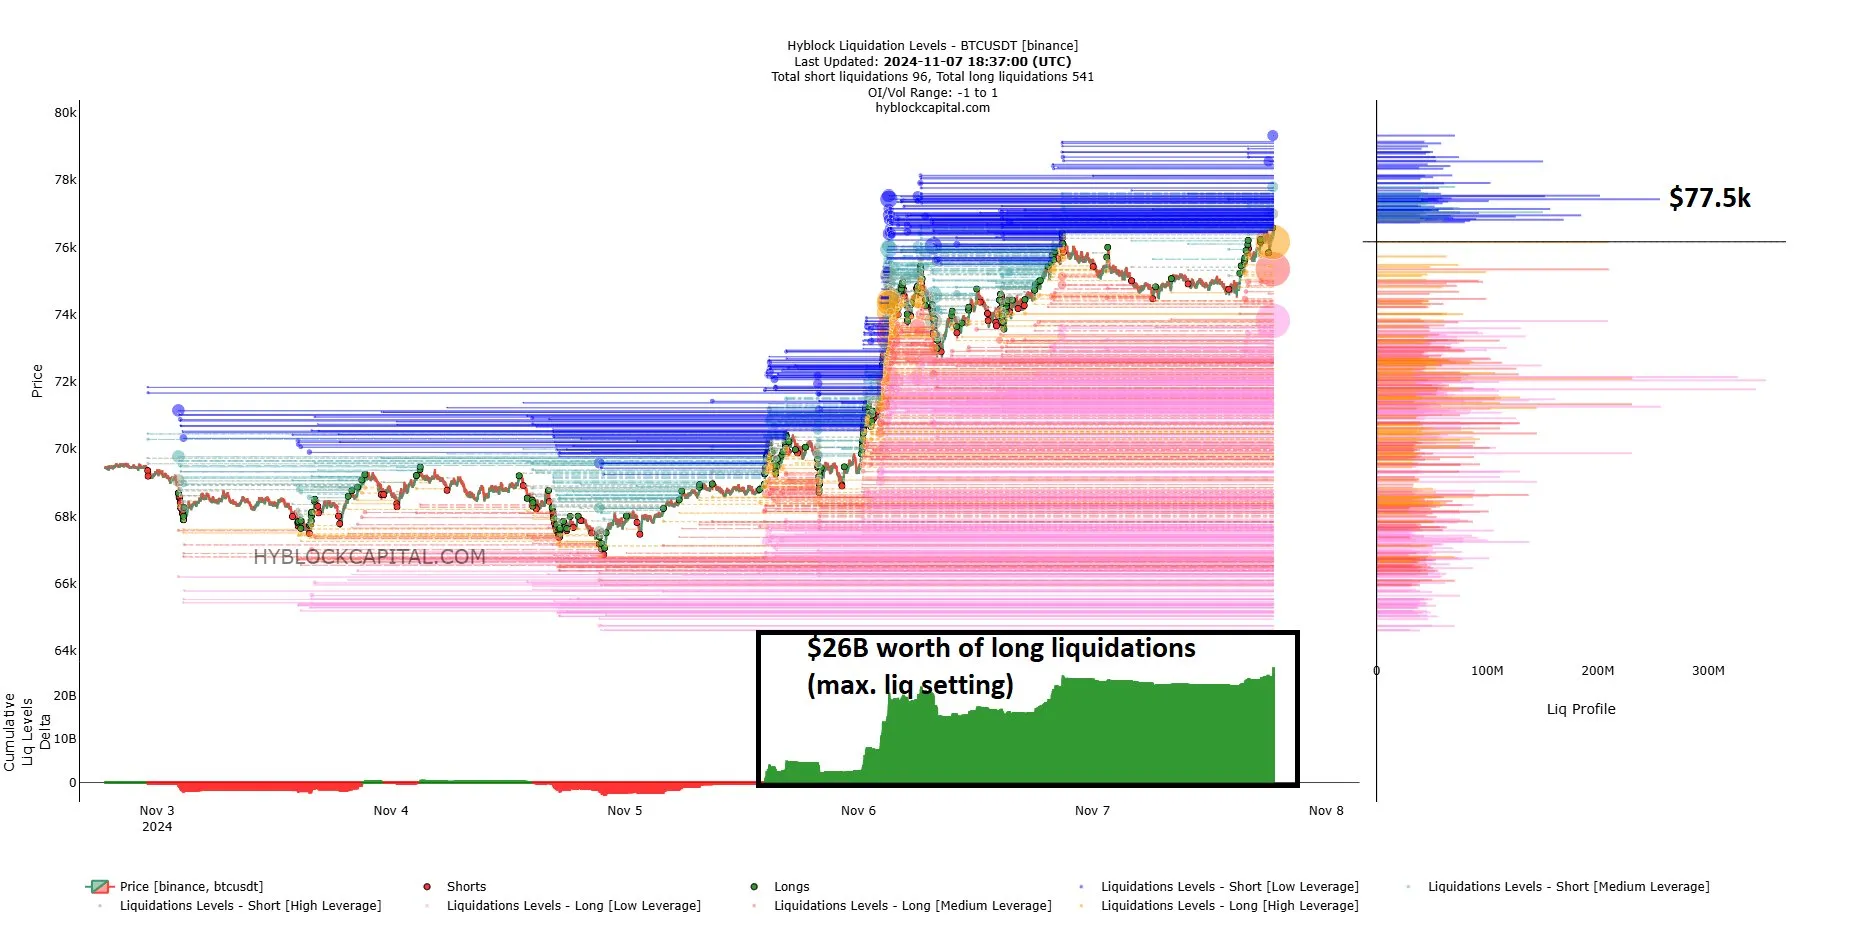
Bitcoin heatmaps highlighted critical zones where significant price movements could occur due to liquidation events.
The first chart showed a clear resistance zone around $77.5k. This could be a target during significant market events like the FOMC announcement.
The clustering of liquidation levels just below this price indicates a high concentration of stop orders. If triggered, that could propel the price toward this upper limit.

The second chart provided a detailed view of recent trading activities, showing a surge in long liquidations. This accumulation suggested that many traders were positioned for further price increases.
They are using high leverage, which increased the risk of a long squeeze. If the market experiences a rapid pullback, these long positions could be liquidated en masse.
That would lead to a sharp decline in Bitcoin’s price as the market attempts to find liquidity. Following the setup, the potential for a pullback to shake out FOMO-driven longs could be real.
Traders might expect a tumultuous period leading up to the weekend, where volatility could increase as these liquidation events unfold.
The scenario pointed to the possibility of both a spike up to $77.5k if bullish pressures prevail during the FOMC, followed by a possible sharp decline if the market corrects and long positions are squeezed out.
Will $80K Mark The Top?
The charts further reflected a recurring pattern of rallies marked by euphoria phases that follow the second most prominent pump in each cycle, as highlighted by the yellow circles.
Historically, after these pumps, Bitcoin experienced substantial gains: 362% in 2013, 566% in 2017, and 406% in 2021. Drawing from these patterns, the chart suggested a potential rise of 236% from the current level around $74k.
This would project a top near $248k if the historical pattern holds. Additionally, the chart indicates that these euphoric tops often become focal points in subsequent bear markets, as shown in the white boxes.
For instance, in the 2015 bear market, Bitcoin’s price dipped just below the previous euphoric high. In 2019 and 2022, it consistently held above it.
The observation supported the theory that $70k to $80k could act as a critical support range in any forthcoming bear market.
The timeline to reach a new euphoric phase could be influenced by similar durations and growth rates as past cycles.
If Bitcoin follows the historical cadence, an acceleration toward euphoria might be anticipated within the next 1-2 years, contingent upon market dynamics and investor sentiment following the previous patterns.
Read the full article here

