


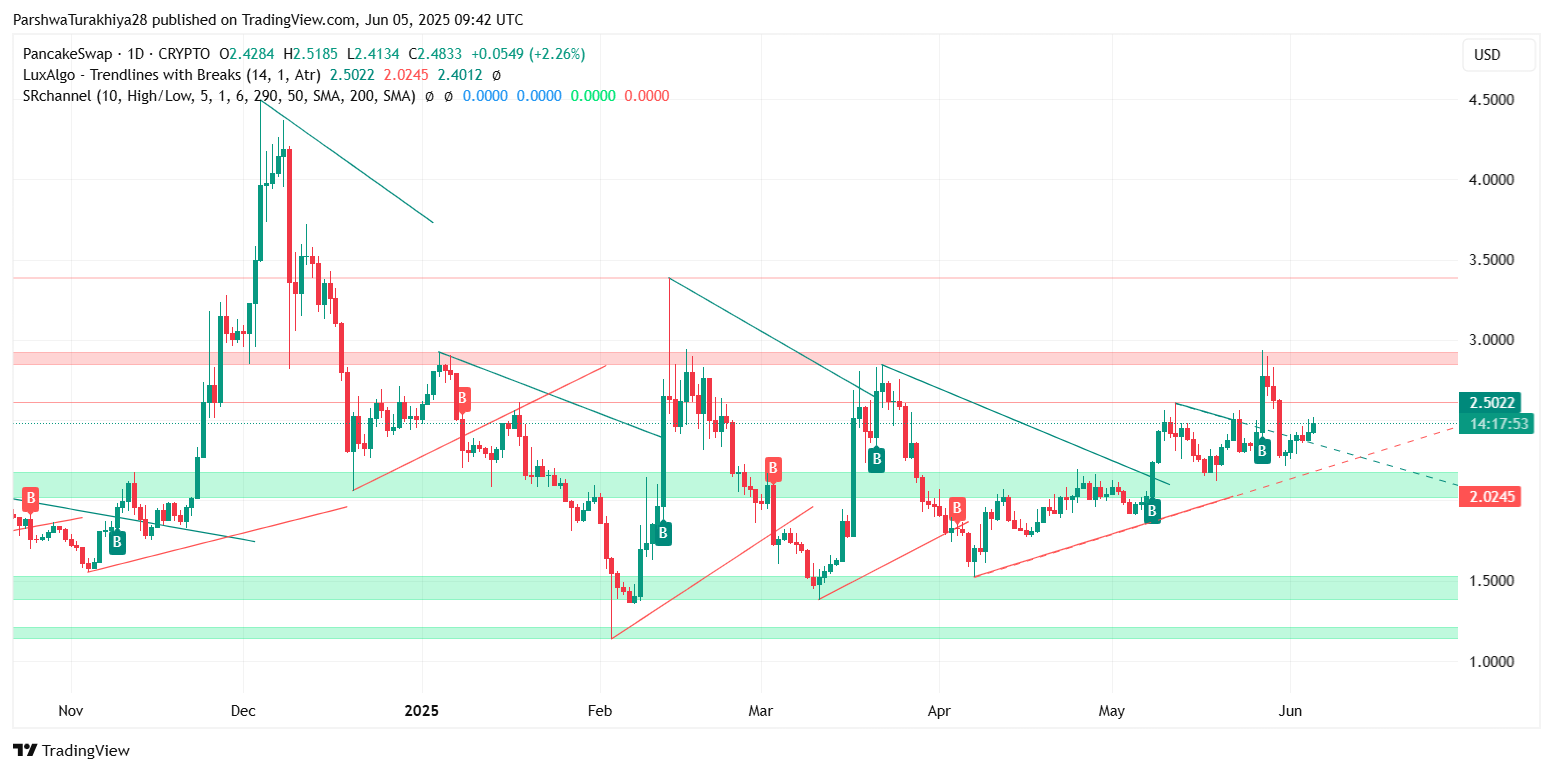
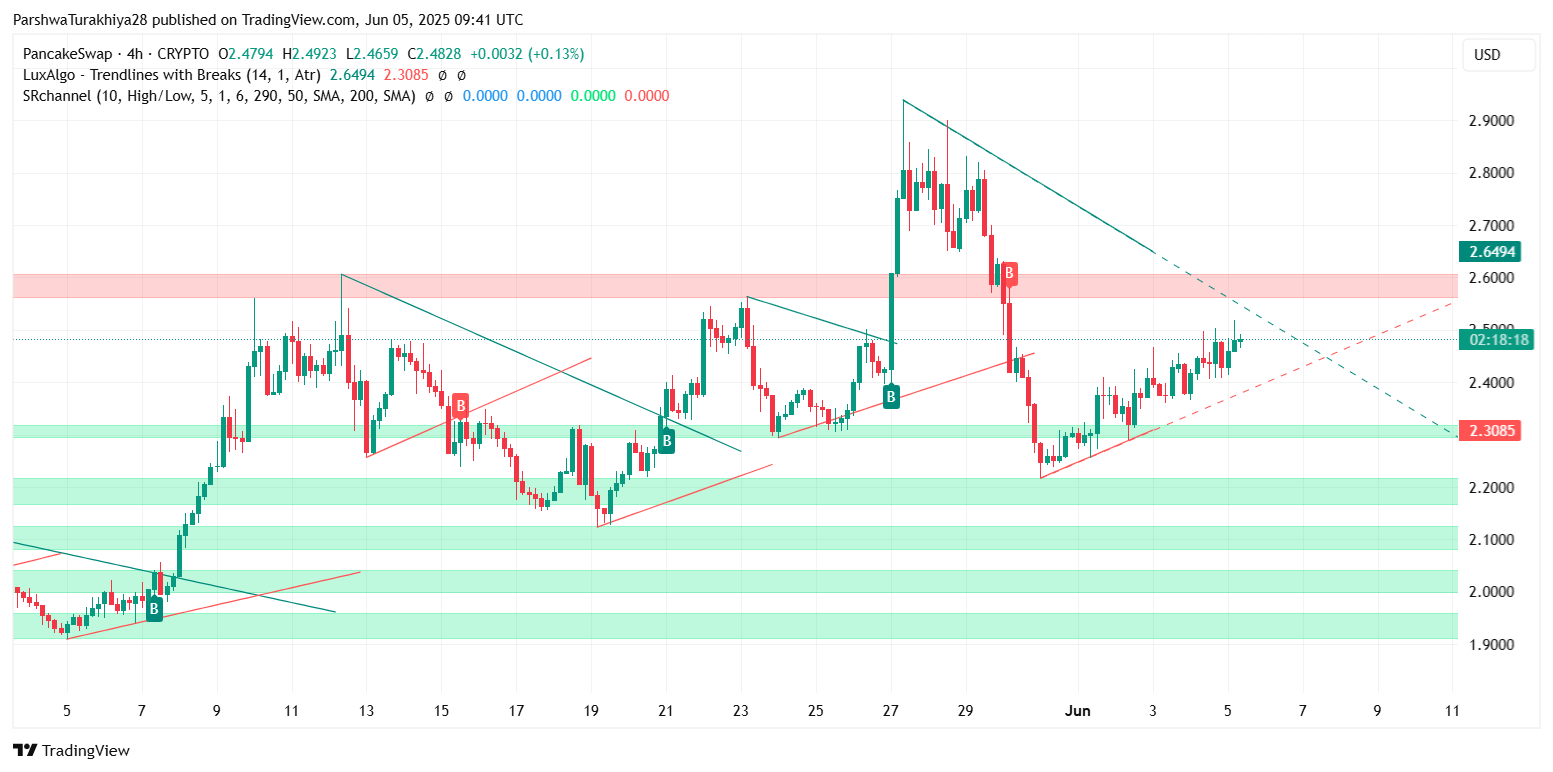
The PancakeSwap price today is holding steady near $2.48 after reclaiming key levels earlier in the week. On June 5, CAKE posted a mild gain of 0.60% and closed the session at $2.4830. The recovery comes after multiple failed breakout attempts in late May. Now, with the price structure climbing toward the upper boundary of its consolidation channel, traders are watching closely for signs of continuation or rejection.
What’s Happening With PancakeSwap’s Price?
CAKEUSD price dynamics (Source: TradingView)
The current PancakeSwap price structure is pressing against a confluence of resistance levels near the 0.618 Fibonacci retracement zone on the weekly chart, positioned around $2.4639. This level has acted as a mid-term pivot since mid-April, with the broader trend still anchored below the $2.85 mark, which represents the 50% retracement level of the move from $1.20 to $4.49.
CAKEUSD price dynamics (Source: TradingView)
The price action on the 1D chart shows a clean ascending triangle forming, with bulls attempting a breakout above descending trendline resistance near $2.50. This structure has historically preceded volatility surges, which raises the possibility of a PancakeSwap price spike if bulls maintain their current momentum.
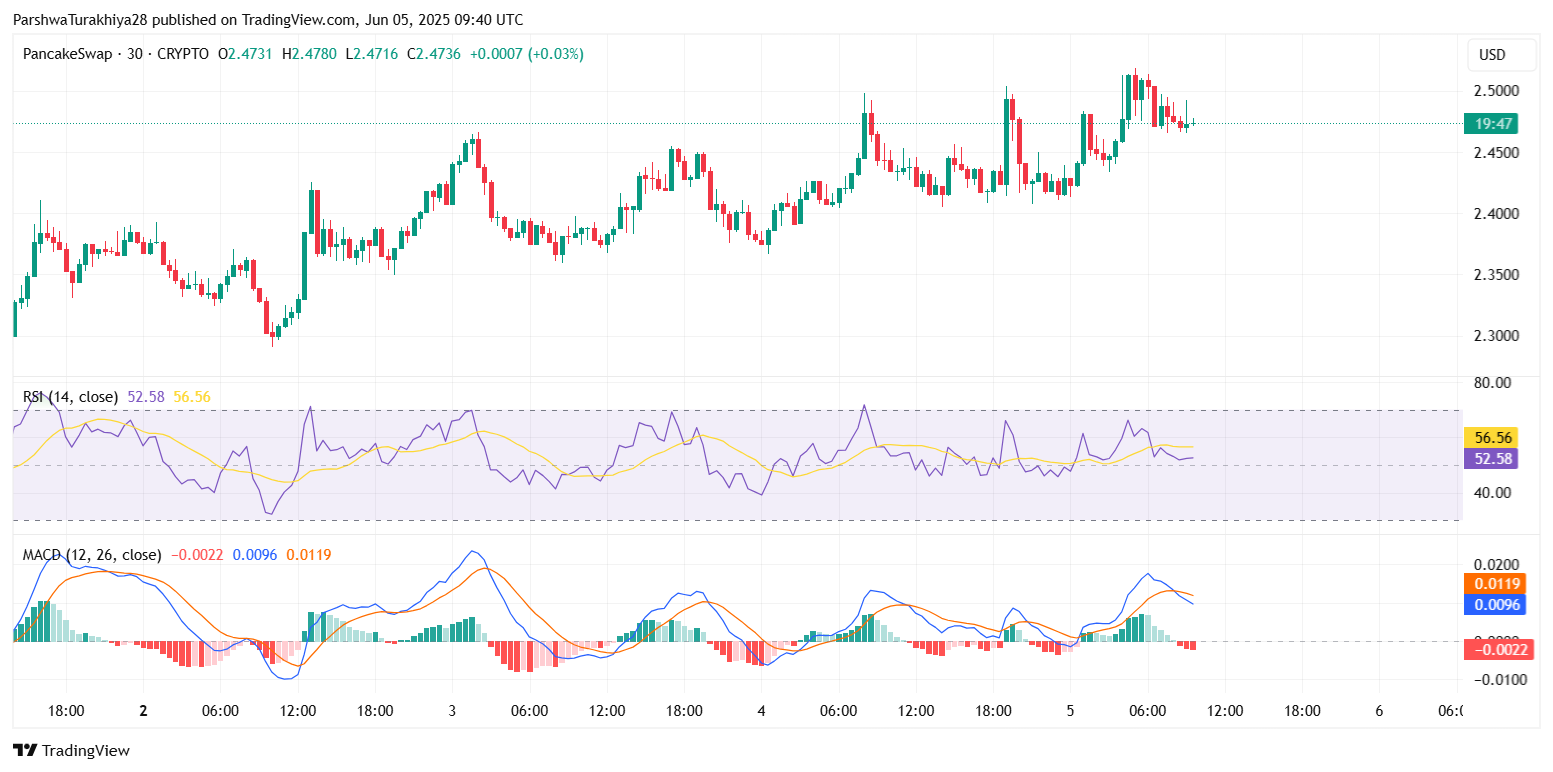
Indicators Flash Mixed Signals as CAKE Moves Sideways
CAKEUSD price dynamics (Source: TradingView)
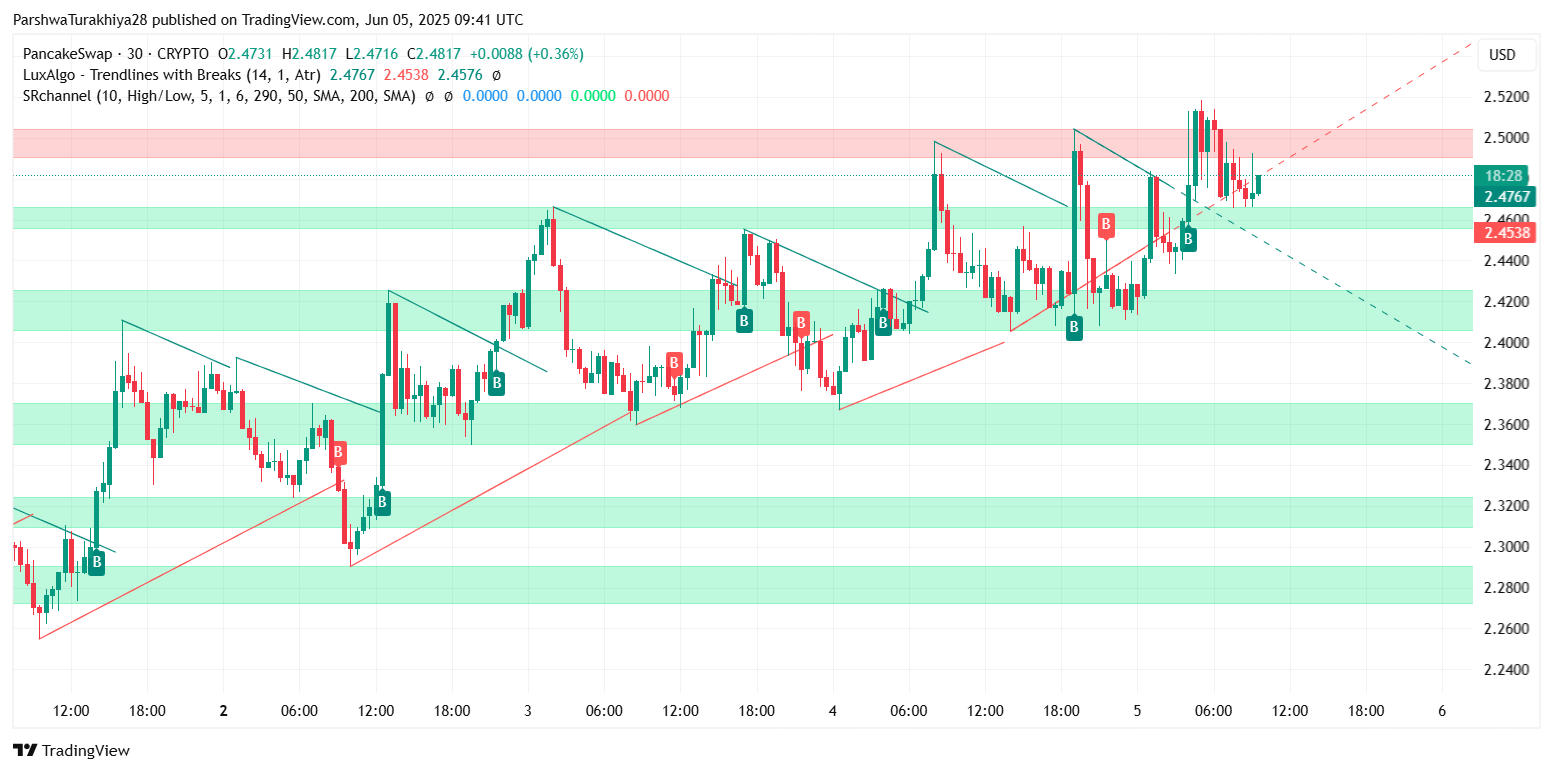
The RSI on the 4-hour chart is hovering just above the 56 level, suggesting moderate bullish momentum without entering overbought territory. More notably, the MACD has recently made a bullish crossover, although its histogram is flattening—indicating that momentum is rising, but without forceful follow-through just yet.
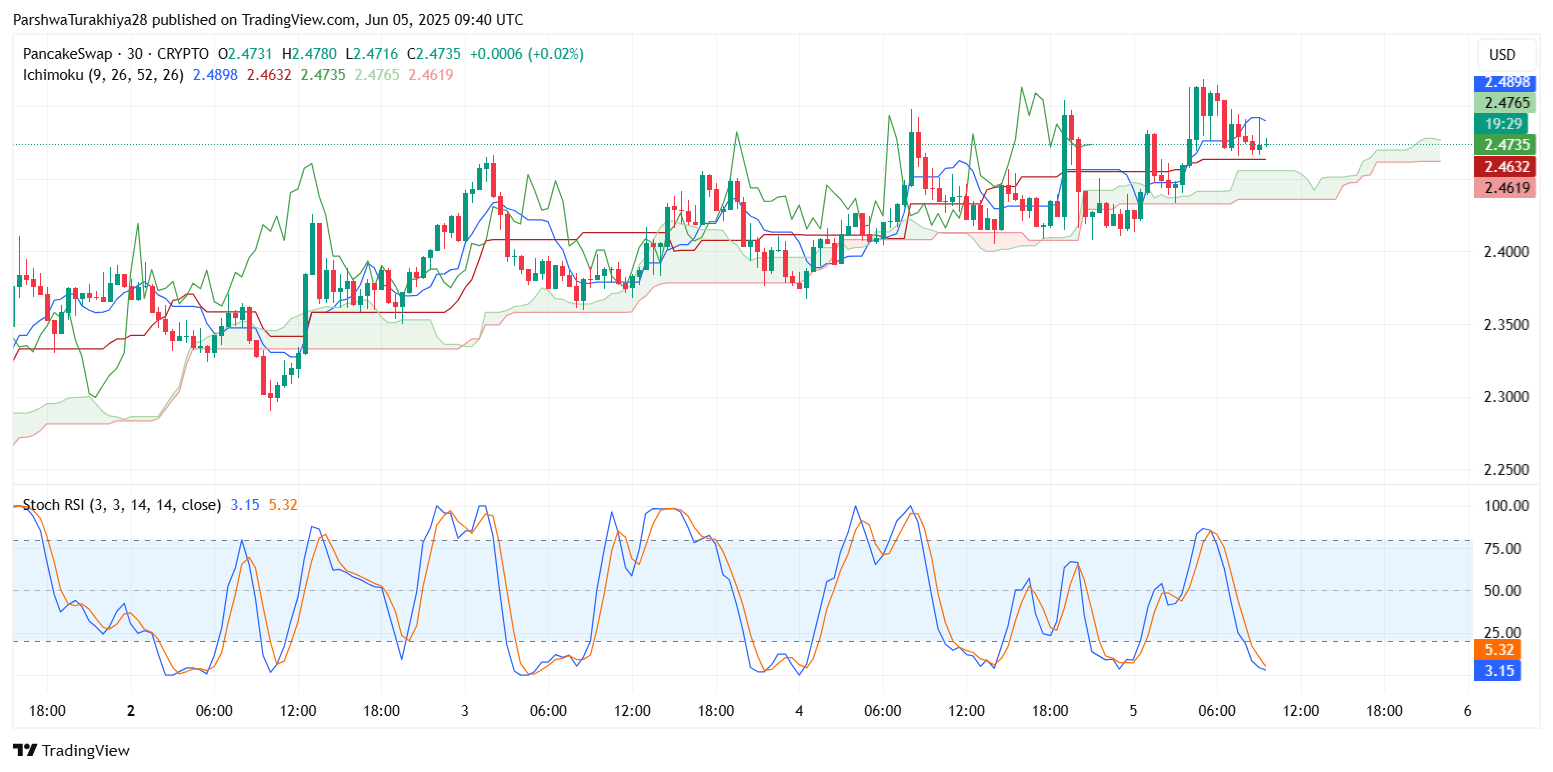
CAKEUSD price dynamics (Source: TradingView)
On the Ichimoku Cloud, CAKE is trading above the Tenkan and Kijun lines on the 30-minute chart, while remaining within a thin cloud on higher timeframes. This signifies short-term bullish bias, although the medium-term PancakeSwap price volatility remains constrained. A clean break above $2.50 backed by volume could open up space for a move toward $2.85–$2.90.
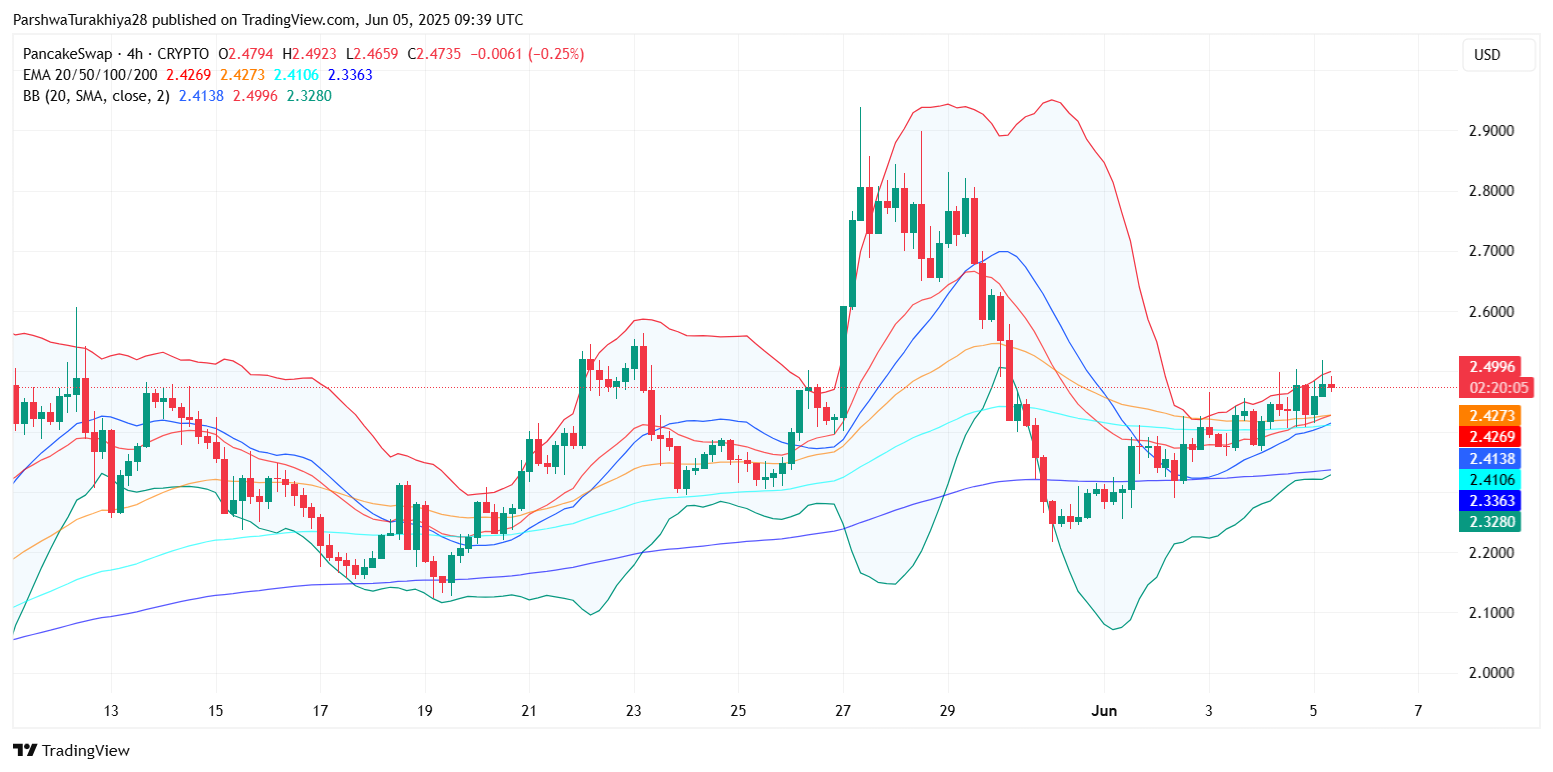
Support Zones Hold, But Bears Still Hover Overhead
CAKEUSD price dynamics (Source: TradingView)
A look at the key demand zones highlights a clear support band between $2.30 and $2.36, which has been tested multiple times since May 31. This area aligns with the lower Bollinger Band on the 4-hour chart and coincides with the 50- and 100-EMA clusters. Unless this zone breaks decisively, short-term downside appears limited.
The weekly candle structure still paints a cautious picture. Even though CAKE has printed green candles in three of the last four weeks, it remains capped beneath the 0.382 Fib level ($3.23) and the early May highs. For a sustainable trend reversal to occur, the token must close above $2.85 and flip that resistance into support.
Why PancakeSwap Price Going Up Today?
CAKEUSD price dynamics (Source: TradingView)
The mild upside in the PancakeSwap price today can be attributed to renewed risk appetite across altcoin markets and the strength of its rising wedge pattern on lower timeframes. Furthermore, the recent bullish crossover on MACD and a bounce from the 20-EMA added tailwinds to the price action. This week’s price stability above $2.45 is crucial, as it signals accumulation within a tightening structure that may be coiling for a breakout.
The PancakeSwap price update shows increasing volume near breakout thresholds, which is often a precursor to directional expansion. However, the rally must be confirmed by a higher high above $2.52 with sustained intraday close to build confidence for targets above $2.60.
Short-Term CAKE Price Forecast: Targets and Risks
CAKEUSD price dynamics (Source: TradingView)
For June 6, the short-term outlook remains cautiously bullish, with momentum favoring upside continuation so long as the $2.43–$2.45 support region remains intact. Upside targets include:
- $2.52: Minor breakout resistance
- $2.60–$2.64: Fib extension zone and recent rejection point
- $2.85: Key psychological and 50% retracement level
On the downside, failure to hold above $2.43 could expose the price to the $2.36 zone and then to the $2.30 liquidity base. Below that, trend support appears around $2.24, marked by a rising diagonal from the May lows.
The technical landscape suggests that CAKE may be on the verge of a significant move, but traders should stay vigilant for false breakouts and maintain risk discipline. A decisive move above $2.60 with volume could mark the start of a more meaningful rally, while a breakdown below $2.30 would invalidate the current bullish bias.
Disclaimer: The information presented in this article is for informational and educational purposes only. The article does not constitute financial advice or advice of any kind. Coin Edition is not responsible for any losses incurred as a result of the utilization of content, products, or services mentioned. Readers are advised to exercise caution before taking any action related to the company.
Read the full article here


