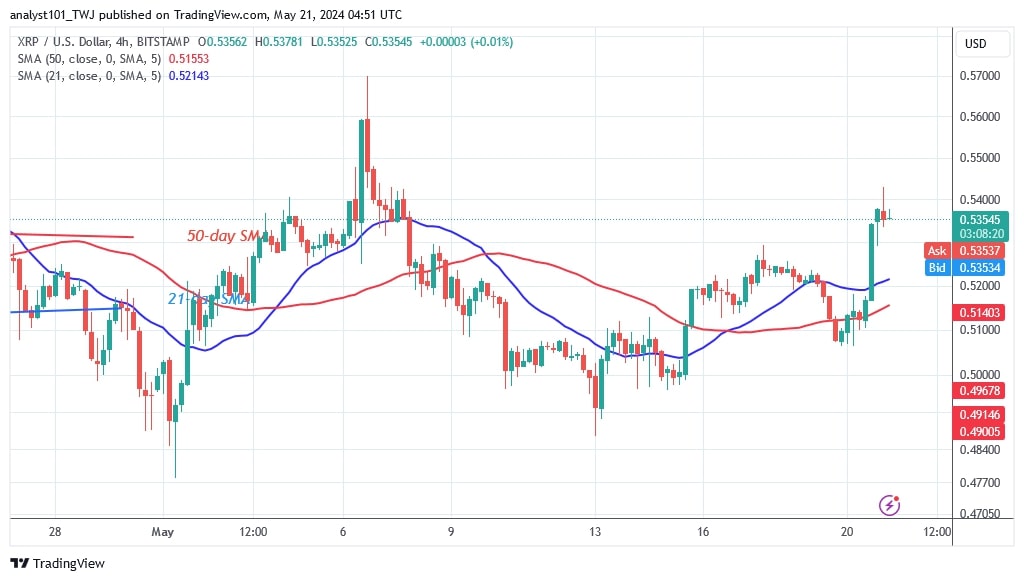
The price of Ripple (XRP) remains in a narrow range between the $0.46 support and the moving average lines.
XRP long-term analysis: bearish
The sideways movement continues as the bulls are unable to break above the 50-day SMA. On May 20, XRP rallied and broke above the moving average lines, but the price stalled at the 50-day SMA. Had the bulls broken through the 50-day SMA barrier, the cryptocurrency might have reached a high of $0.57.
Today, the altcoin is on a downward retreat. The current support level of $0.46 will be retested if the downtrend breaks below the 21-day SMA. Similarly, XRP will drop to a low of $0.41 if the critical support at $0.46 is breached. In the meantime, XRP has fallen between the moving average lines. It is now worth $0.53.
XRP indicator analysis
A false breakout has caused the price bars to fall within the moving average lines. The altcoin is pulling back after being rejected at the 50-day SMA. The 50-day SMA and resistance at $0.54 have halted the uptrend. If the buyers can break the 50-day SMA and resistance at $0.54, the altcoin will resume its uptrend.
Technical indicators:
Key resistance levels – $0.80 and $1.00
Key support levels – $0.40 and $0.20
What’s the next direction for XRP?
Today, buyers are struggling to sustain the bullish momentum above the 50-day SMA and resistance at $0.54. The current choppy movement could continue if XRP is rejected at the 50-day SMA. However, if buyers are successful, an uptrend will begin.

Disclaimer. This analysis and forecast are the personal opinions of the author and are not a recommendation to buy or sell cryptocurrency and should not be viewed as an endorsement by CoinIdol.com. Readers should do their research before investing in funds.
Read the full article here

