


Key takeaways:
-
XRP has consolidated for nearly 200 days between $1.90 and $2.90, with analysts split on the next move.
-
A 2017 chart fractal suggests a target between $3.70 and $10, with some even eyeing $25.
-
A bearish chart pattern could invalidate bullish setups, targeting a drop to $1.33.
XRP (XRP) is nearing 200 days of consolidation within a broad $1.90–$2.90 range, leaving traders split on the next move.
The XRP/USD pair has been trading relatively sideways since its ~500% surge in November 2024, repeatedly attempting to break out of the range.
The pattern reflects a market locked in indecision, with neither bulls nor bears able to establish dominance. Still, most analysts and chartists are beginning to see XRP breaking out to the upside next.
XRP’s 2017 fractal hints at 75% “epic” upside
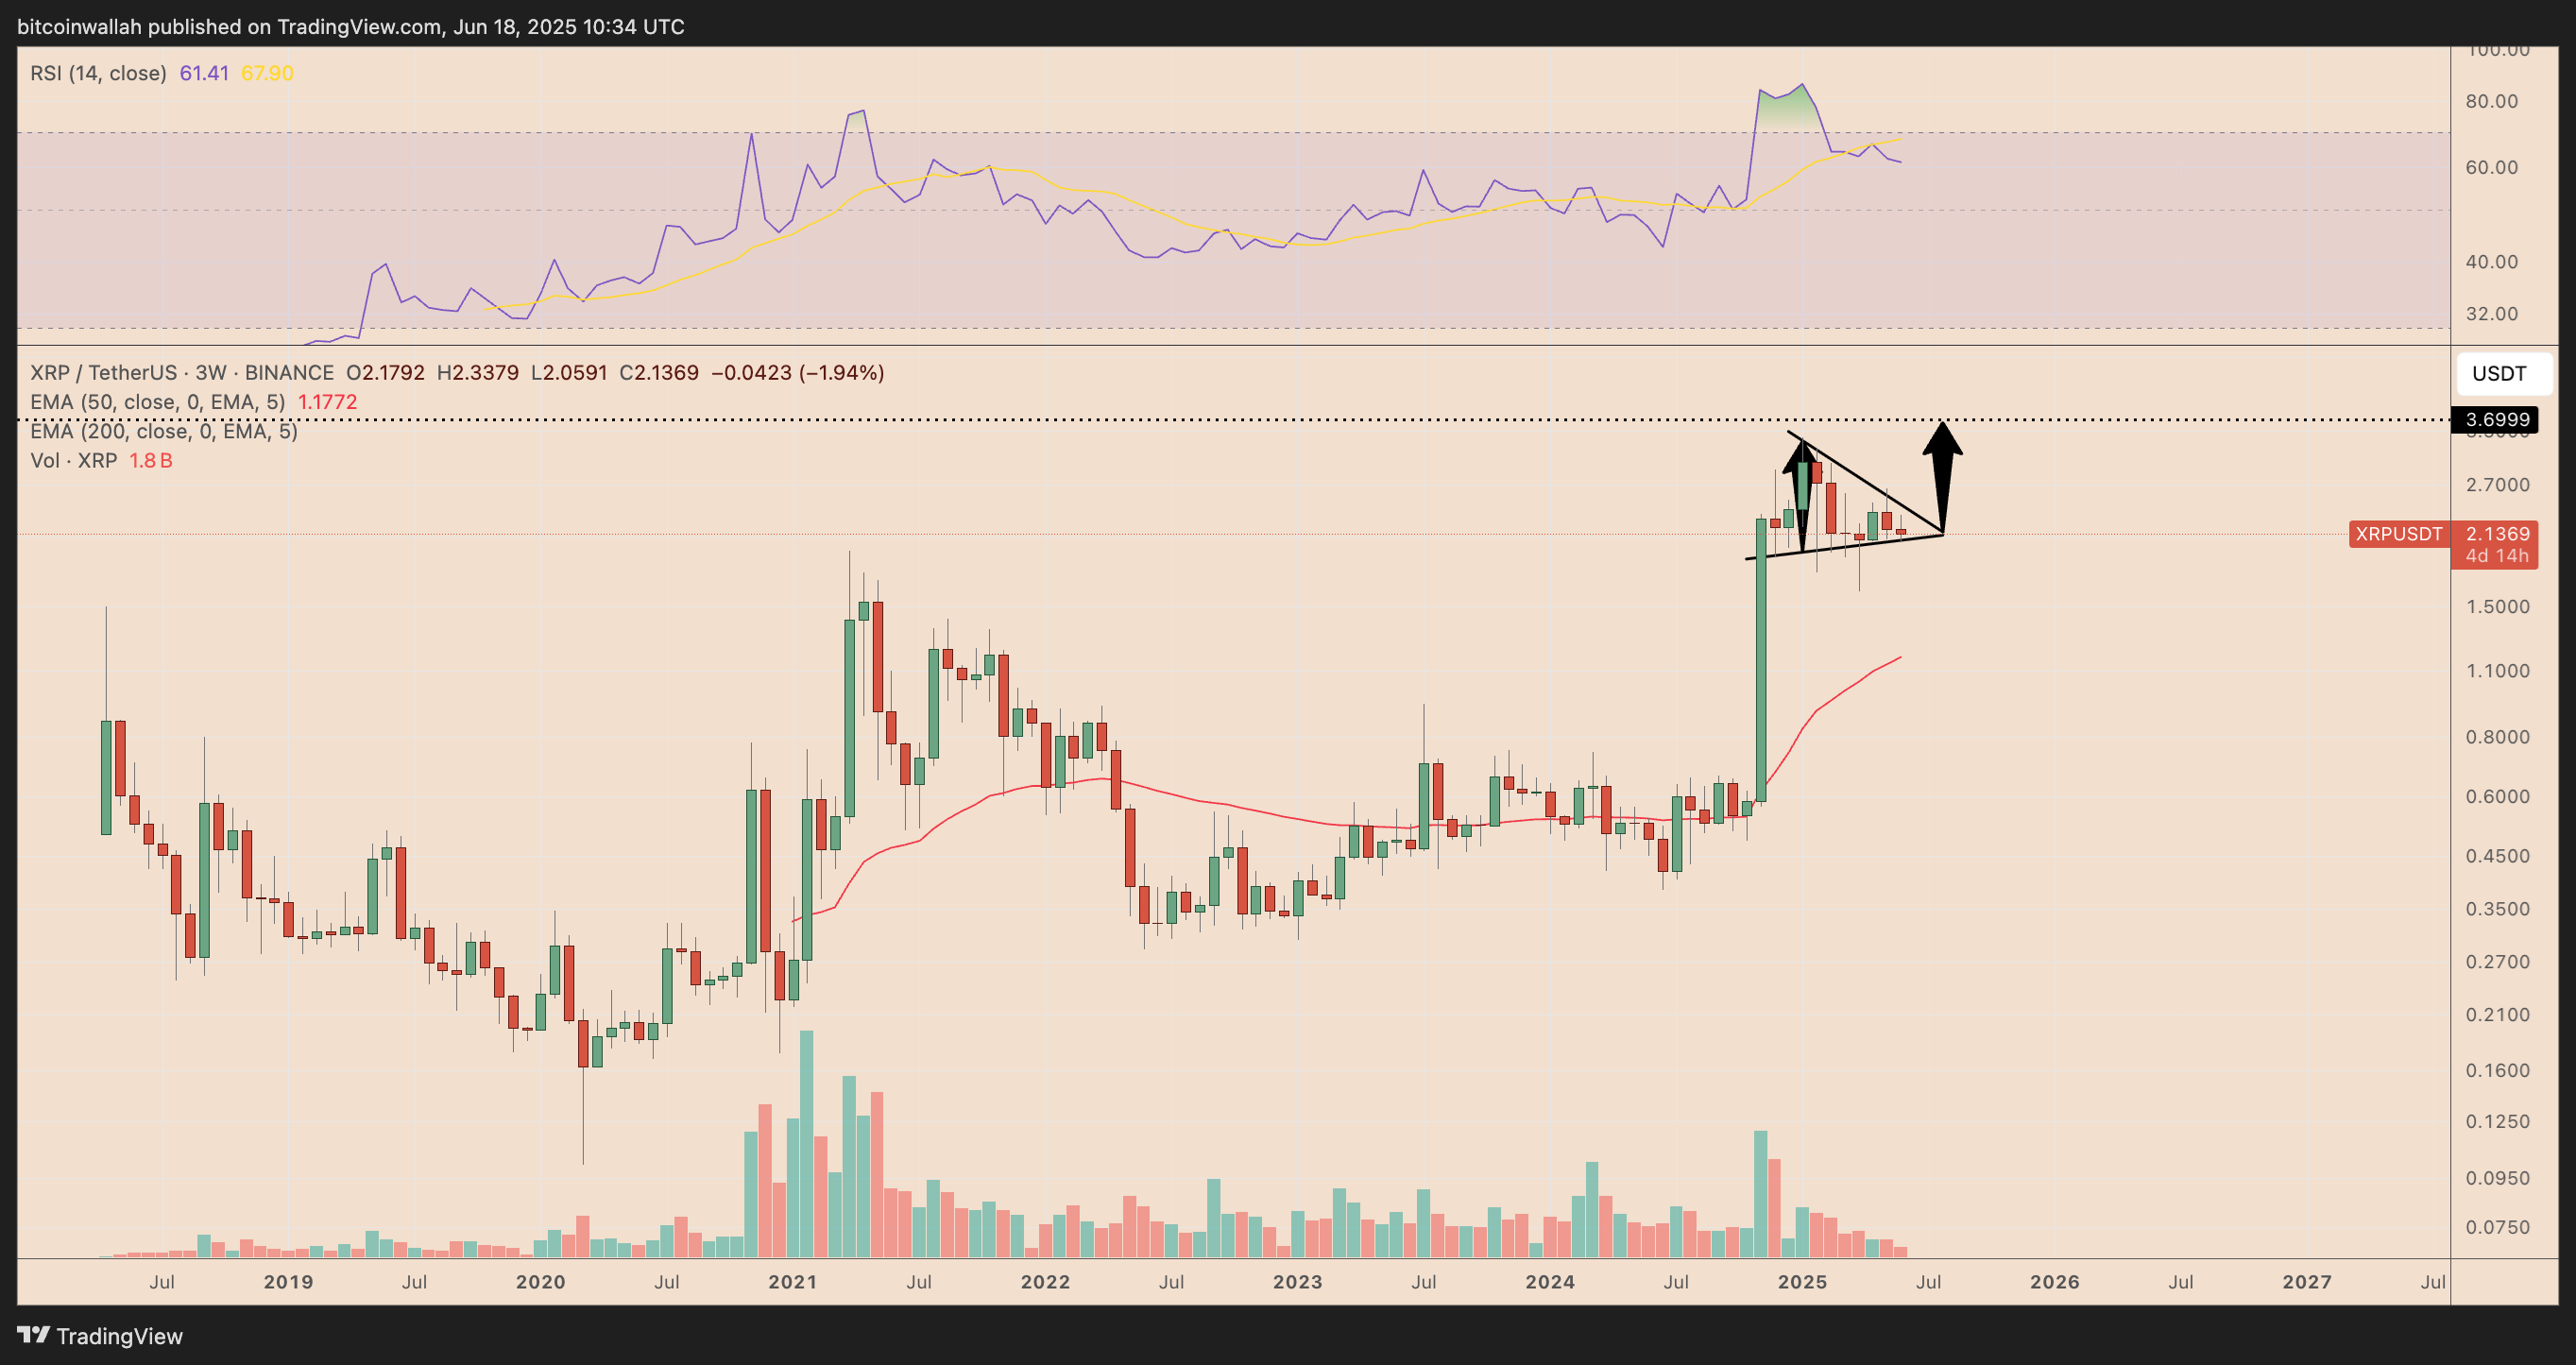
XRP’s 200-day consolidation cycle includes a symmetrical triangle structure similar to the one that preceded a strong breakout in 2017, according to crypto analyst Mikybull Crypto.
In a Tuesday post, the analyst noted striking similarities between the current three-week chart and the structure that preceded XRP’s 1,300% rally to $3.40.
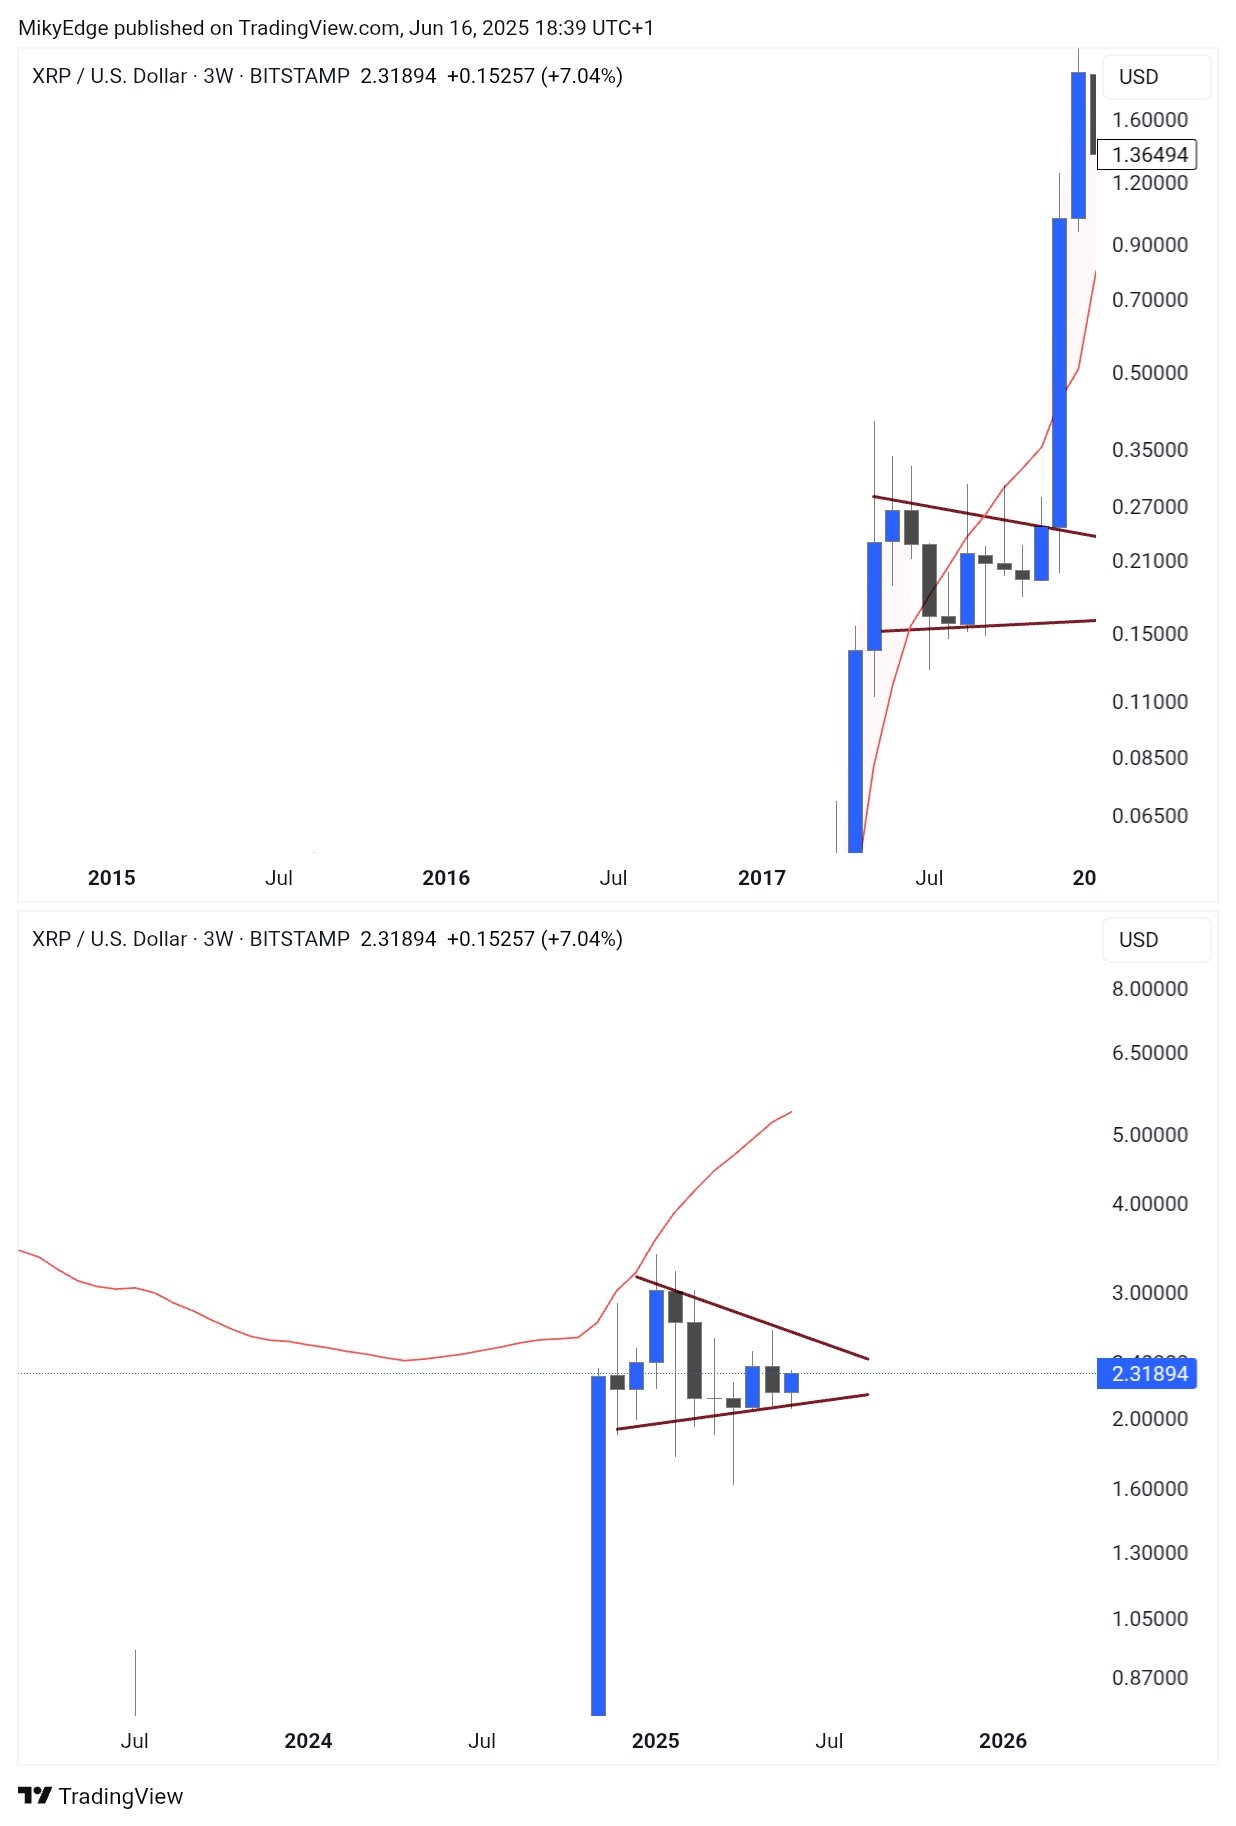
Symmetrical triangles are neutral patterns that can resolve with either sharp upside or downside moves.
Analyst XRPunkie sees the triangle resolving into an “epic breakout” above $4.
When measured from the triangle’s apex point, XRP’s breakout target is around $3.70, or 75% gains from current levels, if the 2017 breakout from a similar pattern is any indication.
XRP’s “six-year of consolidation” suggests $10 top
Crypto analyst GalaxyBTC highlighted a striking long-term fractal on XRP’s weekly chart, suggesting the altcoin may be repeating its 2017 breakout setup, only after a much longer consolidation.
In a chart shared on May 20, the analyst shows XRP breaking out and retesting a multi-year descending trendline, mirroring its 2014–2017 structure.
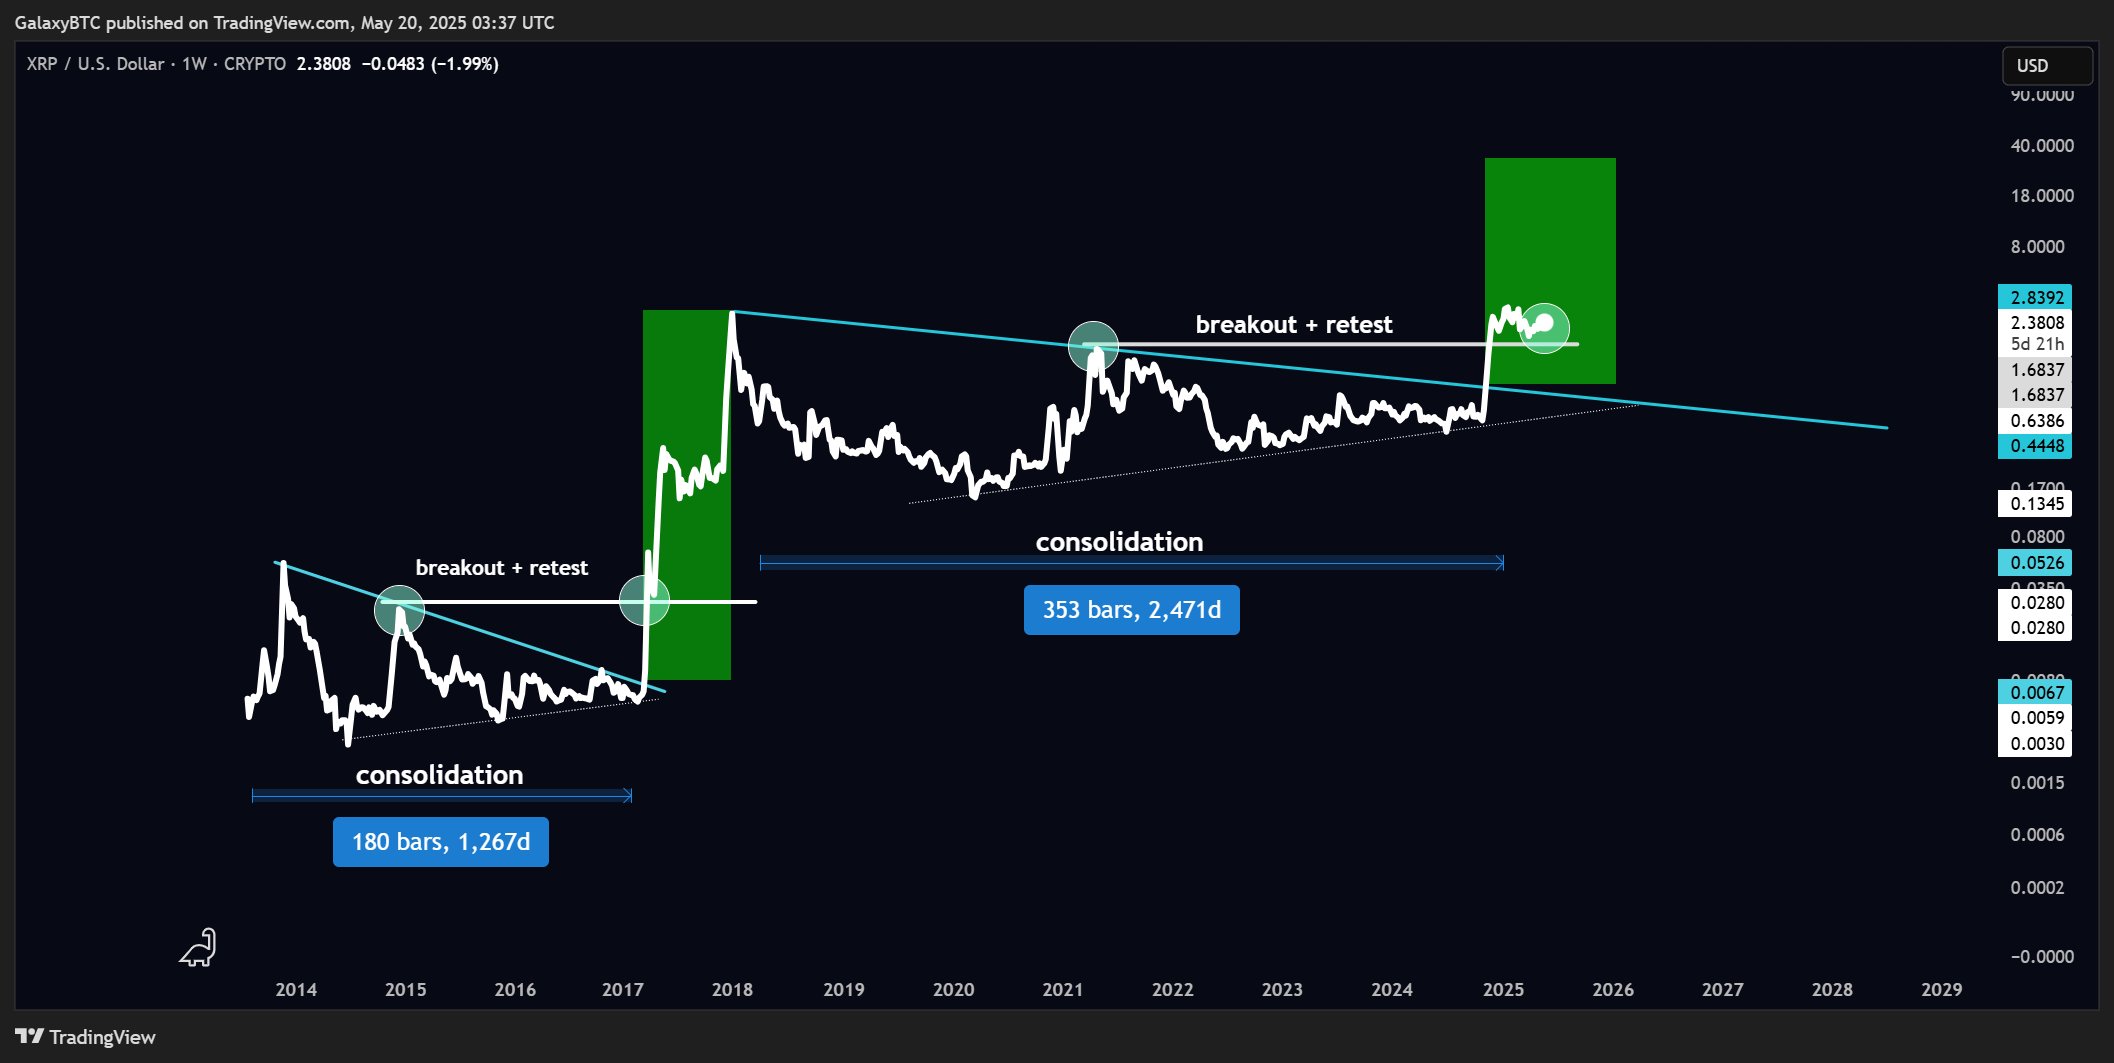
That prior consolidation lasted 1,267 days and led to a 1,300% rally toward $3.40. The current consolidation has lasted over 2,470 days, or nearly seven years, potentially setting the stage for an even larger move.
Related: SEC opens Franklin Templeton XRP, SOL ETF proposals to comments
If XRP mirrors its 2017 breakout, a 1,300% rally from the recent breakout zone near $0.63 would place the next potential top between $8 and $10.
Other projections are even more ambitious, with some analysts citing Fibonacci targets and ETF-driven scenarios that put XRP’s top near $25–$27.
XRP bears pin hopes on a cup-and-handle pattern
XRP’s multimonth price action appears to be forming an inverse cup-and-handle, a bearish reversal structure.
The pattern shows XRP peaking near $2.90 in March before gradually rounding off and breaking below its short-term support.
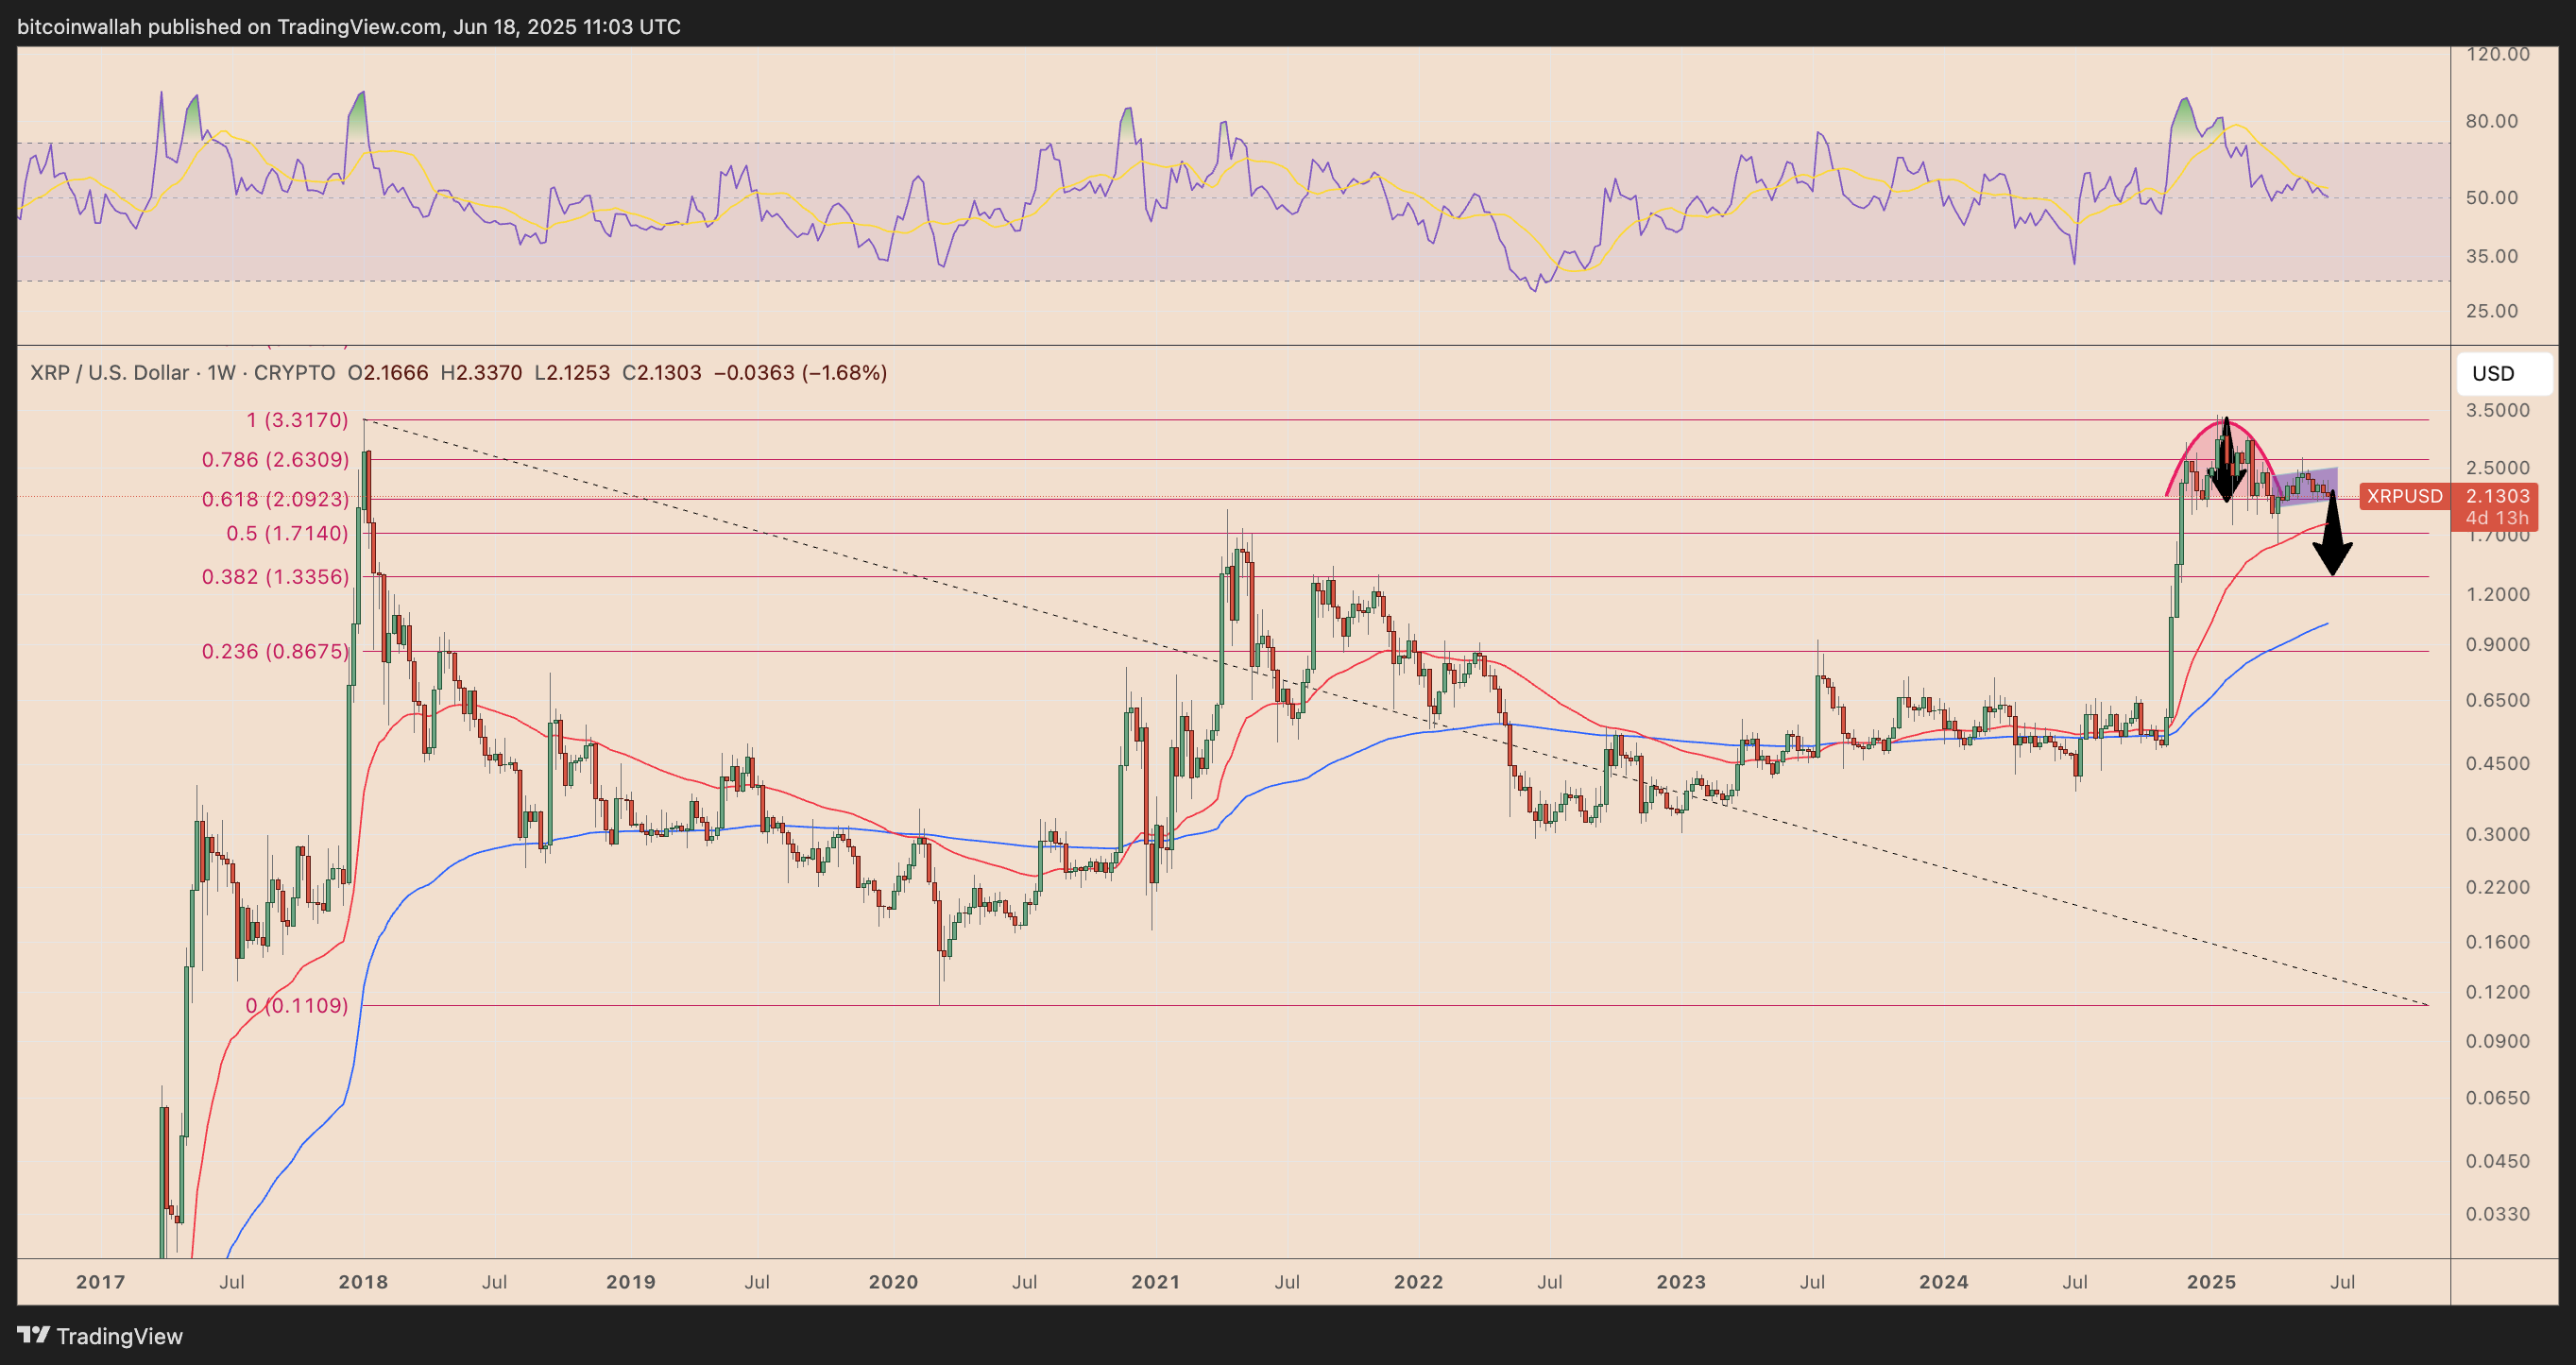
If confirmed, the setup projects a potential decline toward the 0.382 Fibonacci retracement level near $1.33, aligning with a key 0.382 Fibonacci retracement line support that served as a resistance during the 2021 XRP correction.
This article does not contain investment advice or recommendations. Every investment and trading move involves risk, and readers should conduct their own research when making a decision.
Read the full article here


