


XRP has been on a steady climb over the past few days, fueled by a reduction in liquidation activity among its long-term holders (LTHs).
On-chain data reveals a marked slowdown in token movements among these investors, indicating that LTHs are holding firm rather than selling off their positions. This hints at a sustained price rally in the short term.
XRP Shows Signs of Accumulation as LTH Selloff Activity Declines
According to data from Glassnode, XRP’s liveliness has steadily declined since June 5, slipping by 1% to reach 0.809 as of June 8, signaling reduced activity among LTHs.
Liveliness tracks the movement of long-held/dormant tokens. It does this by measuring the ratio of an asset’s coin days destroyed to the total coin days accumulated. When the metric climbs, it means that LTHs are moving their coins or selling them.
On the other hand, when it falls like this, LTHs are moving their assets off exchanges, a move typically seen as a bullish signal of accumulation.
Further, this positive shift in holder behavior is echoed in the XRP derivatives market, evidenced by its consistently positive funding rate since June 6. As of this writing, this is at 0.0080%, signaling that most traders are betting on continued upside.

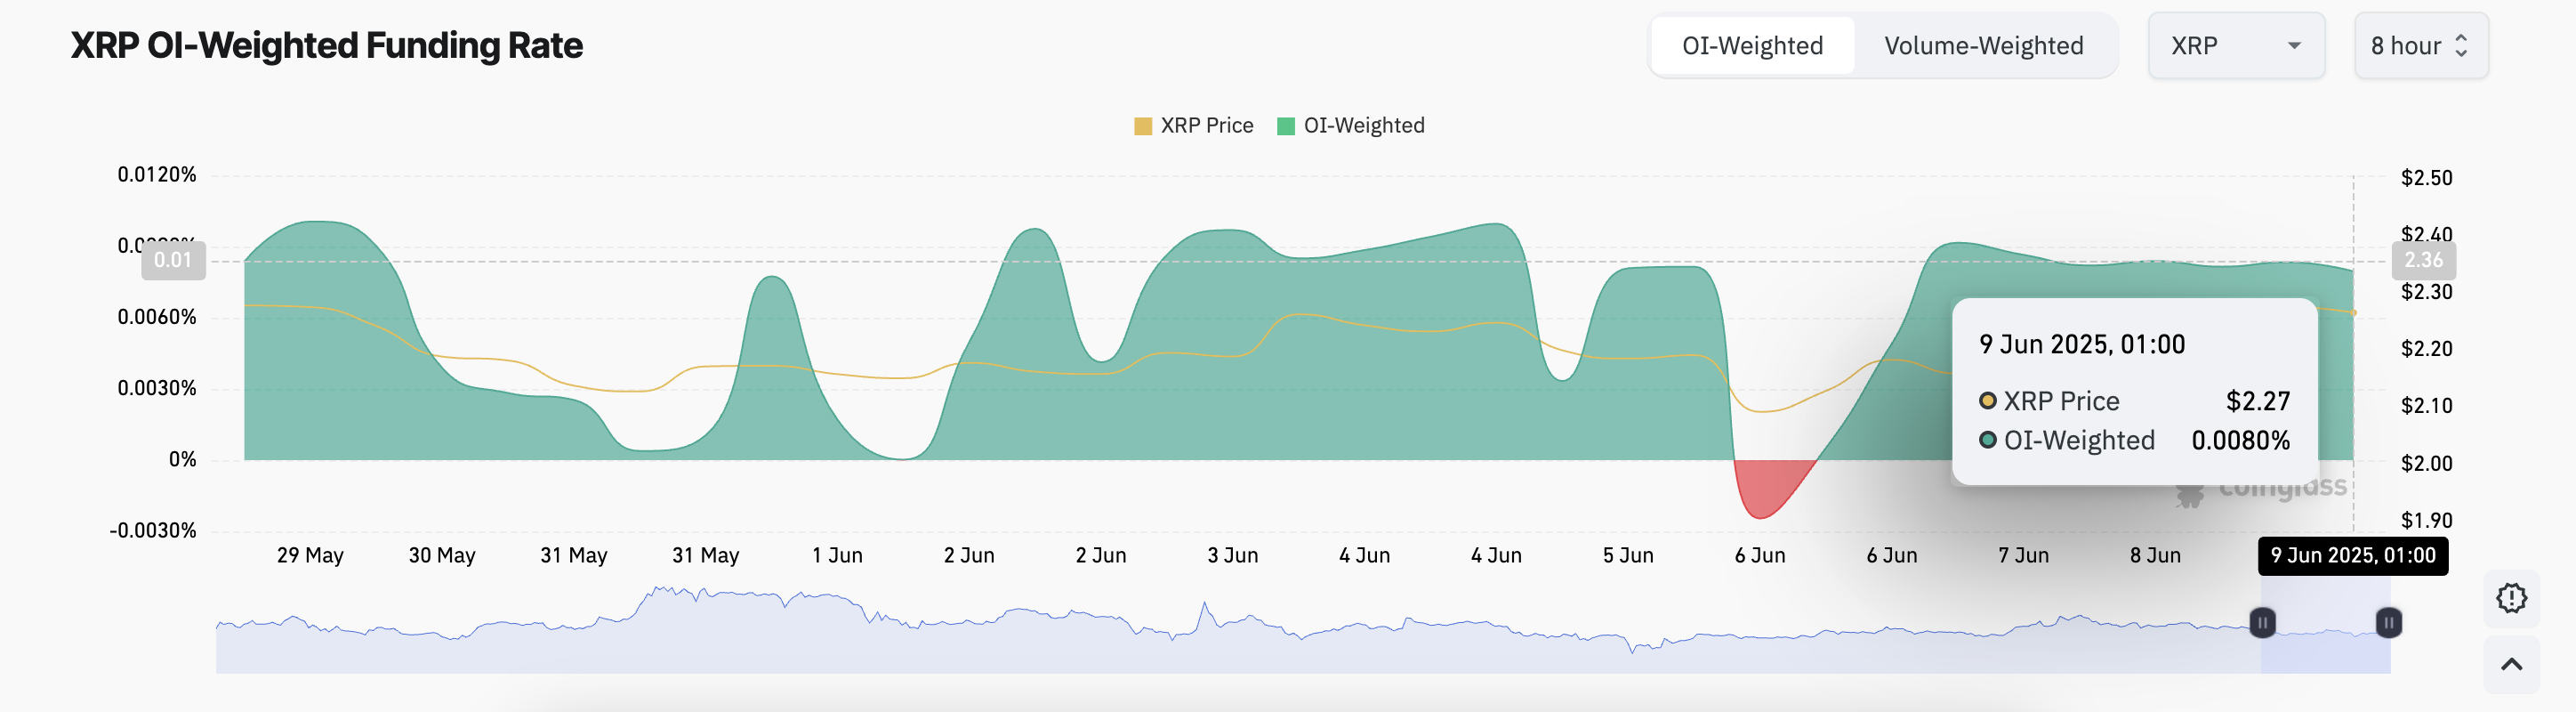
The funding rate is a periodic fee exchanged between traders in perpetual futures markets to keep contract prices aligned with the spot price.
When positive, it implies that long positions are dominant and that short sellers are willing to pay to keep their positions open, a strong indicator of bullish sentiment.
XRP Teeters Between Breakout and Pullback as Golden Cross Looms
Readings from the XRP/USD one-day chart confirm the potential bullish shift, as the token’s Moving Average Convergence Divergence (MACD) indicator hints at the formation of a golden cross. This occurs when the MACD line (blue) prepares to cross above the signal line ( orange), a setup widely regarded as a bullish momentum signal.
The MACD indicator identifies trends and momentum in an asset’s price movement. It helps traders spot potential buy or sell signals through crossovers between the MACD and signal lines. When the MACD line is above the signal line, it indicates bullish momentum, suggesting that the asset’s price may continue to rise.
A successful formation of the golden cross will confirm XRP’s rally and could push its price past the resistance at $2.29, toward $2.50.

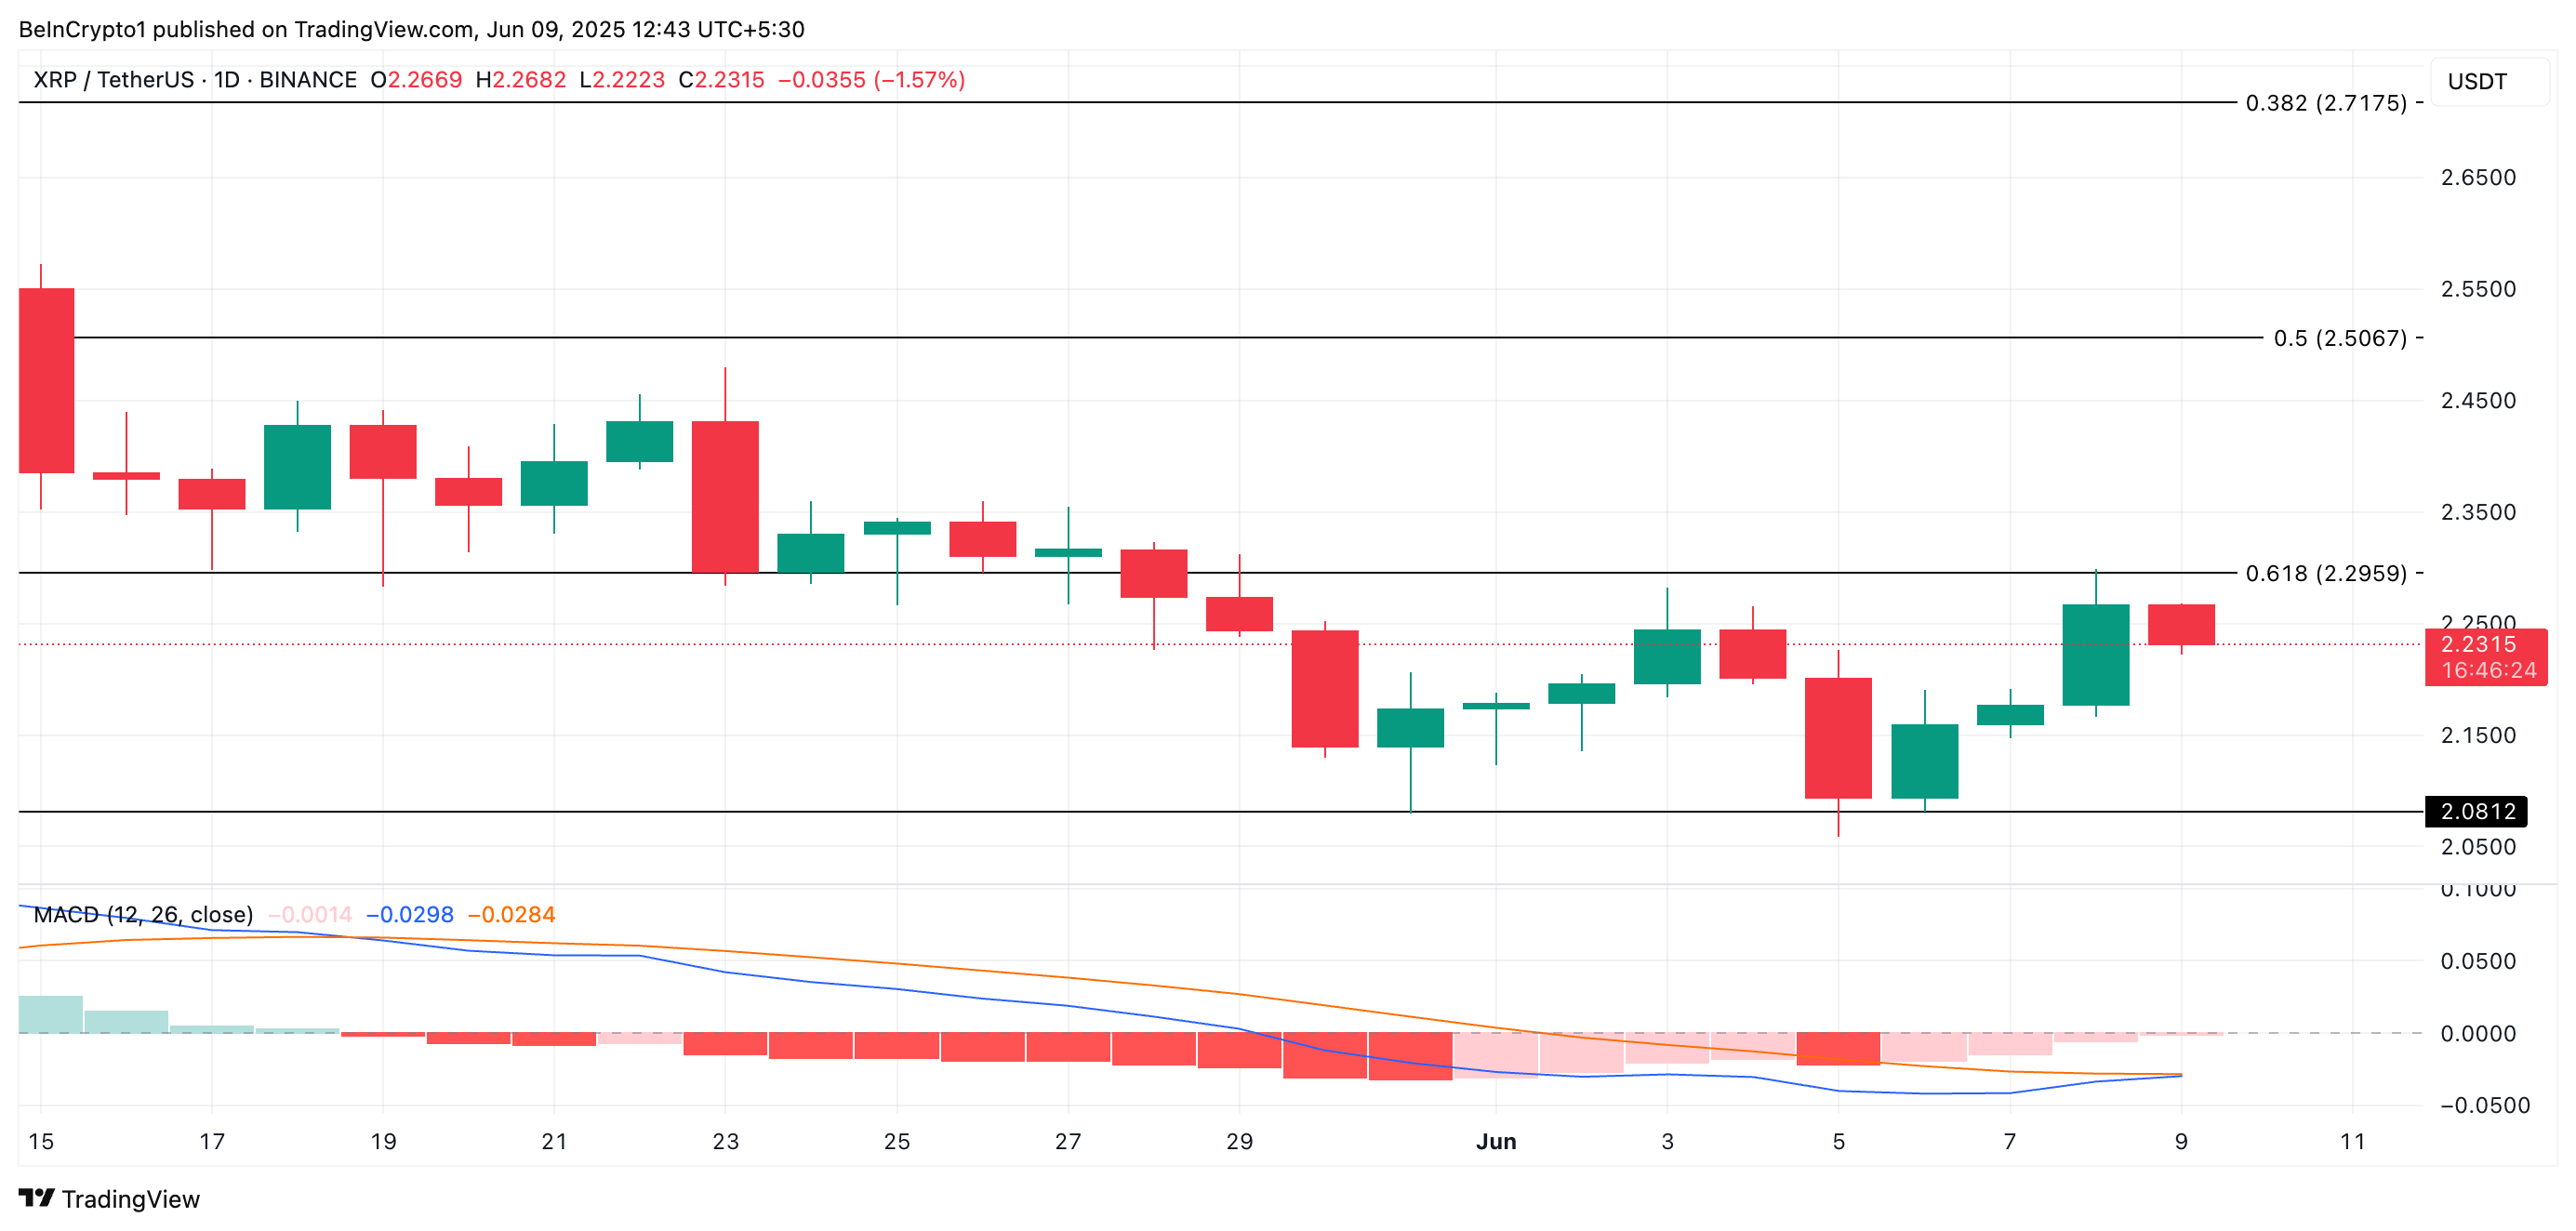
On the other hand, a bearish resurgence could cause the altcoin to lose some gains and fall to $2.08.
Disclaimer
In line with the Trust Project guidelines, this price analysis article is for informational purposes only and should not be considered financial or investment advice. BeInCrypto is committed to accurate, unbiased reporting, but market conditions are subject to change without notice. Always conduct your own research and consult with a professional before making any financial decisions. Please note that our Terms and Conditions, Privacy Policy, and Disclaimers have been updated.
Read the full article here


