


As of Feb. 9, 2025, XRP hovered at $2.41, commanding a market valuation of $138 billion—trailing behind USDT’s $141 billion valuation in fourth spot—while posting a 24-hour turnover of $3.2 billion and an intraday dance between $2.39 and $2.50.
XRP
XRP’s 1-hour chart reveals a phase of lateral equilibrium, with prices oscillating between $2.35 and $2.45. A defensive line has emerged near $2.30, where purchasing activity has materialized, while the $2.5 threshold acts as a ceiling for bullish advances. Trading activity has tapered off, hinting at muted participation; a definitive breakout signal is essential before directional commitments. A constructive pattern near $2.35-$2.40—such as higher lows or a reversal candlestick—may present a strategic entry, with profit-taking horizons at $2.50 and $2.60.
XRP/USDC via Binance 1H chart on Feb. 9, 2025.
The 4-hour timeframe illustrates an extended descent from $3.10 to $2.30, where prices have found tentative footing. This hints at a provisional base, though distribution dynamics linger. Overhead supply looms at $2.50-$2.60, positioning a basing pattern near $2.30-$2.40 as a tactical entry. Stealth accumulation at XRP’s support zones serves as a harbinger of reversal, advising partial exposure reduction at $2.60 and complete exits around $2.80 should vigor return.
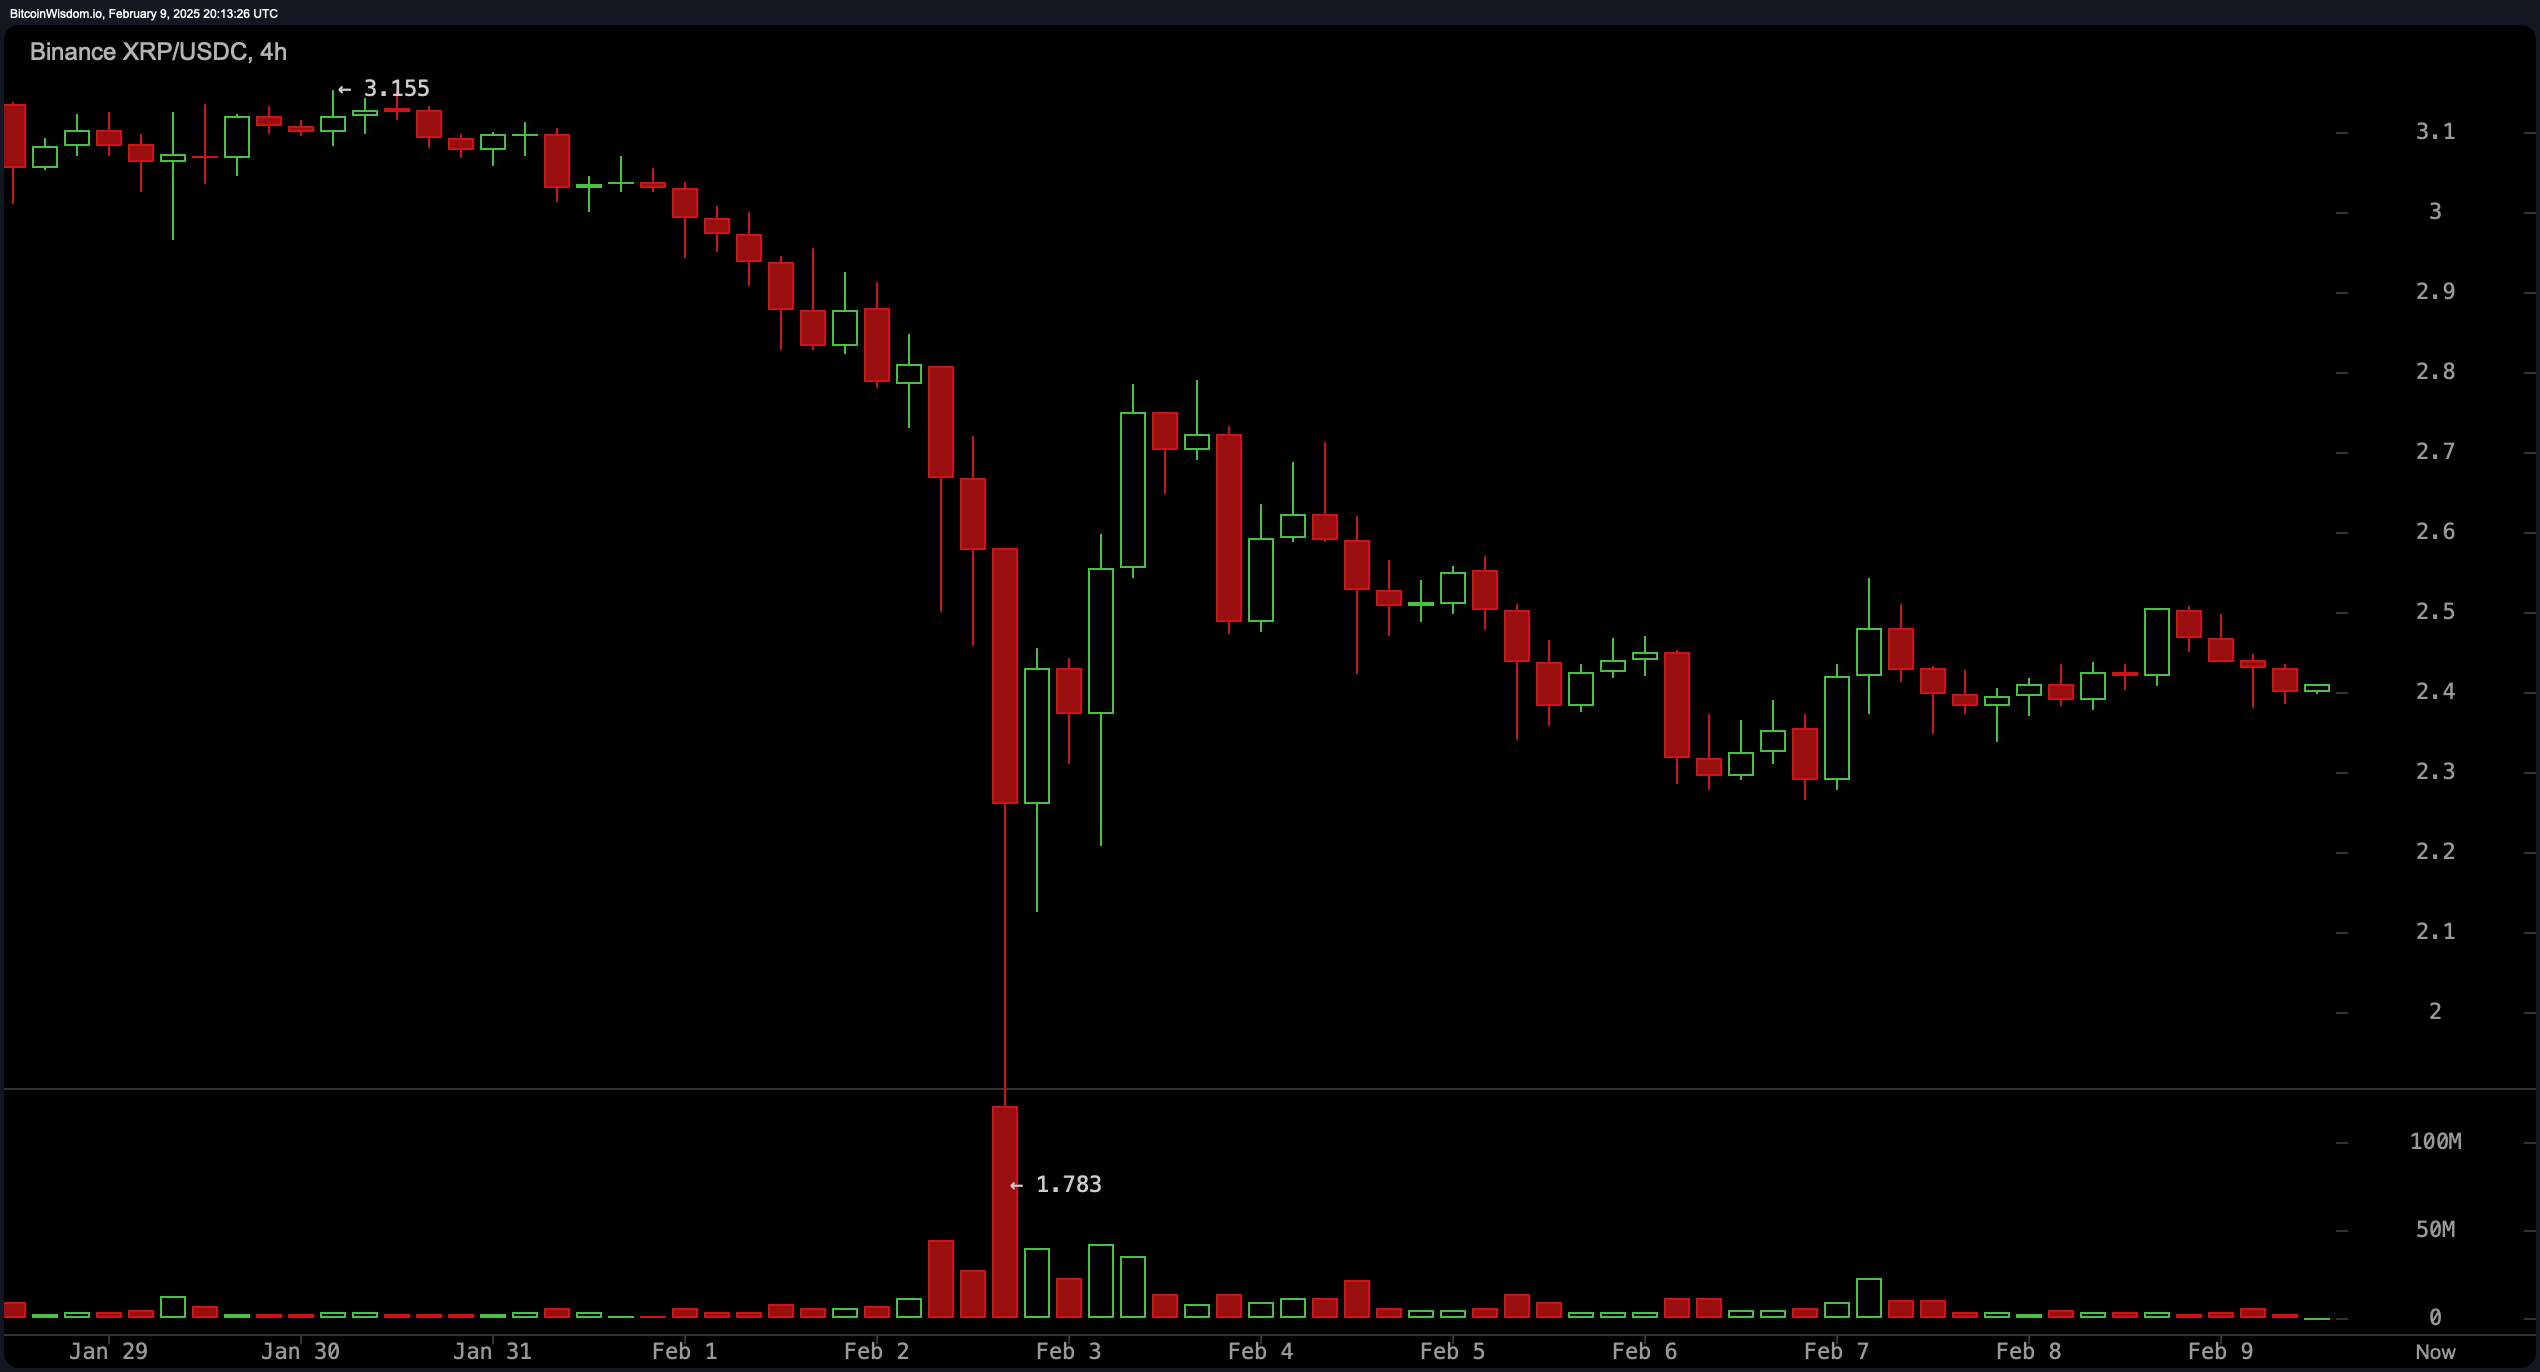
XRP/USDC via Binance 4H chart on Feb. 9, 2025.
The daily perspective chronicles a precipitous retreat from the $3.40 zenith, with prices probing the $2.20 bastion. Elevated turnover during the plunge reflects a distribution crescendo, yet conditions flirt with exhaustion. Should this foundation hold between $2.2-$2.30, a renaissance targeting $2.80-$3.00 may unfold. A failure here, however, invites further descent, necessitating disciplined risk protocols.
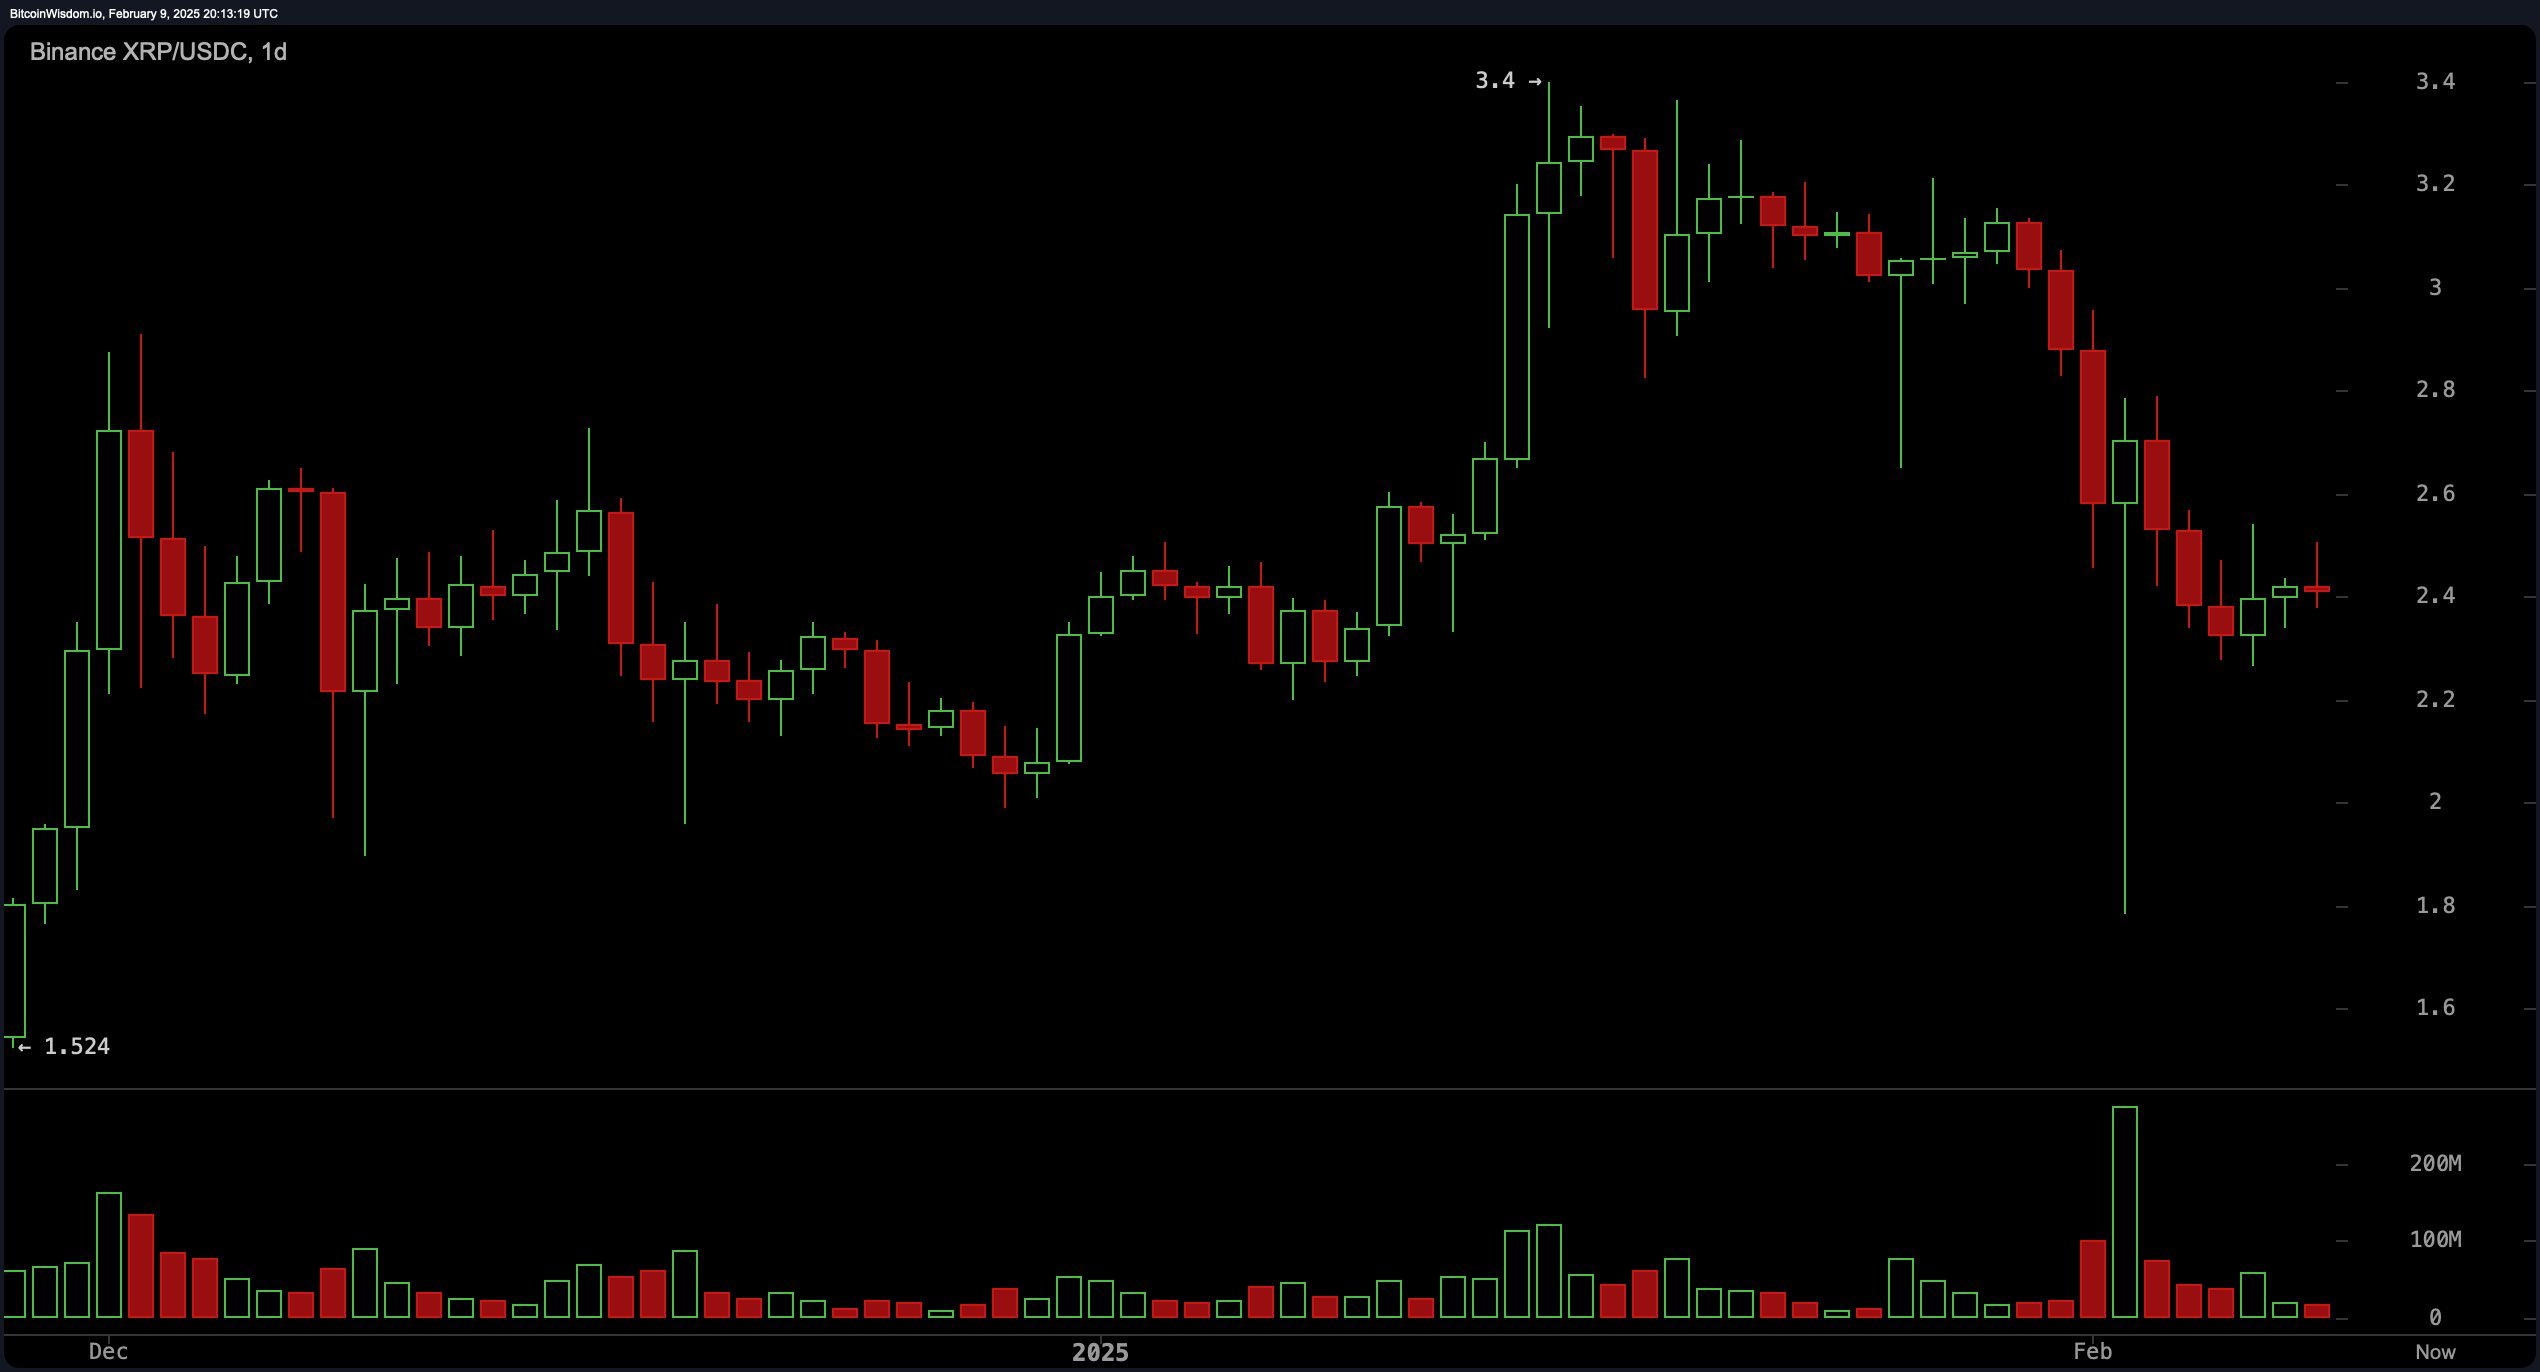
XRP/USDC via Binance 1D chart on Feb. 9, 2025.
Momentum gauges paint a mixed tableau: The relative strength index (RSI) sits at 37.86, Stochastic at 44.27, commodity channel index (CCI) at -90.12, and average directional index (ADX) at 33.85. Yet the awesome oscillator, momentum indicator, and moving average convergence divergence (MACD) tilt toward a negative bias, suggesting prudence for those eyeing rapid gains.
Trend-following tools echo the bearish chorus, with exponential and simple moving averages (EMA/SMA) across 10-, 20-, and 30-day spans issuing sell directives. The 50-period EMA and SMA maintain their downward stance, while 100- and 200-period averages extend an olive branch to optimists. Ichimoku’s baseline remains noncommittal, demanding corroboration before a conclusive trend declaration.
Bull Verdict:
Despite short-term bearish pressure, XRP’s ability to hold support at $2.20 to $2.30 could trigger a rebound, with a potential push toward $2.80 to $3.00 if buyers step in. Long-term moving averages remain bullish, suggesting that a broader uptrend is still intact. A confirmed breakout above $2.6 would strengthen bullish momentum and invalidate the current downtrend.
Bear Verdict:
XRP remains under strong selling pressure, with multiple moving averages signaling a continued decline. The failure to reclaim key resistance at $2.50 to $2.60 could lead to further downside, especially if the $2.20 support line fails. Bearish momentum indicators, including the moving average convergence divergence (MACD) and momentum, reinforce the risk of an extended correction toward lower levels.
Read the full article here

 Price Prediction for February 9")

 Bulls on Verge of Massive FOMO")