


Key takeaways:
-
XRP’s most-profitable investors are realizing over $68M in profits daily, mirroring the run-up to the 2017 market top.
-
Over 70% of XRP’s realized cap has formed since late 2024, making the market top-heavy and vulnerable to sharp sell-offs.
-
If selling from newer holders continues, XRP risks a 35% decline toward the $1.35–$1.60 range.
XRP (XRP) traders who bought before the November 2024 rally, when the Ripple-associated token was trading under $0.50, are now realizing profits at a pace of $68.8 million per day (7-day average), per Glassnode data.
These buyers are among the biggest gainers in XRP’s current cycle, with returns exceeding 300%. Most of the realized profit activity is coming from this group, signaling a wave of distribution now that prices have tripled.
XRP metric mirrors a 90% crash scenario
XRP traders’ behavior appears similar to what preceded XRP’s 2017 cycle top.
Back then, XRP surged to over $2.50 from around $0.005 in under a year, leading to a spike in profit-taking behavior by high-margin holders.
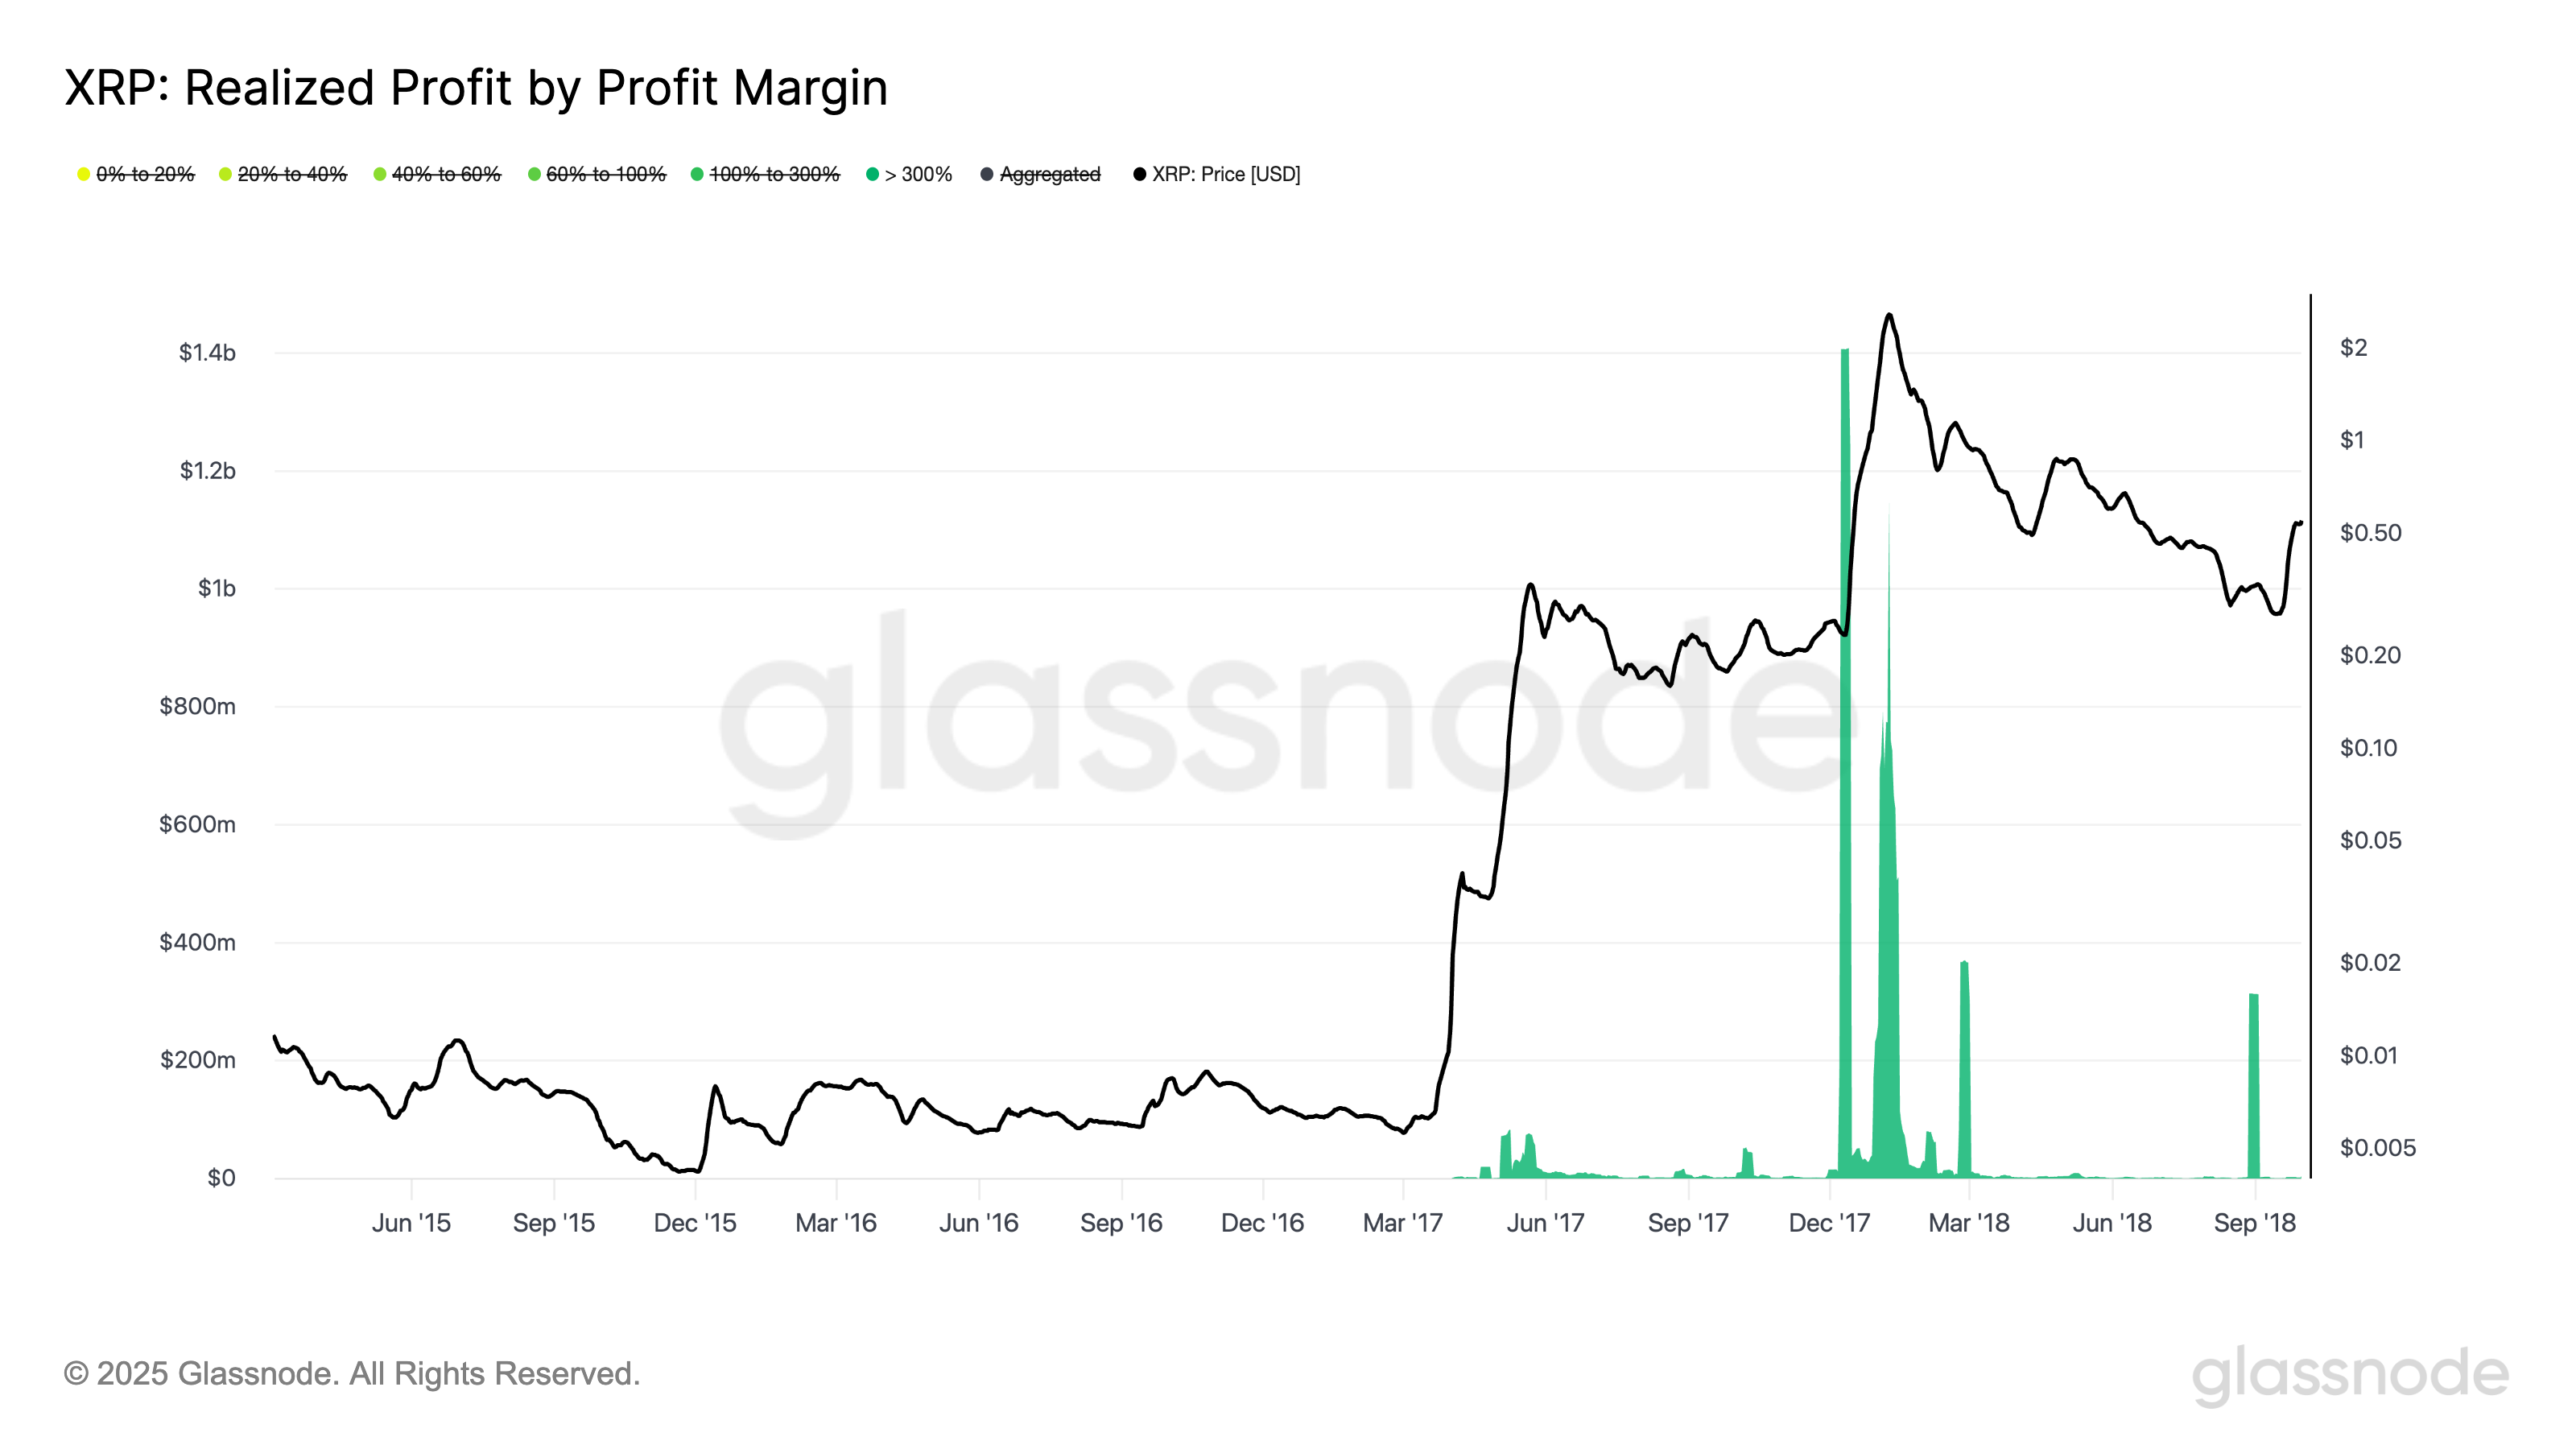
The realized profit from >300% gainers peaked just before the market topped, which followed a 90% downtrend. XRP faces risks of further correction in the coming months if the fractal plays out as it did in 2017-2018.
Adding to this concern, over 70% of XRP’s realized market cap, a measure based on the price at which each token last moved, has formed between late 2024 and early 2025.
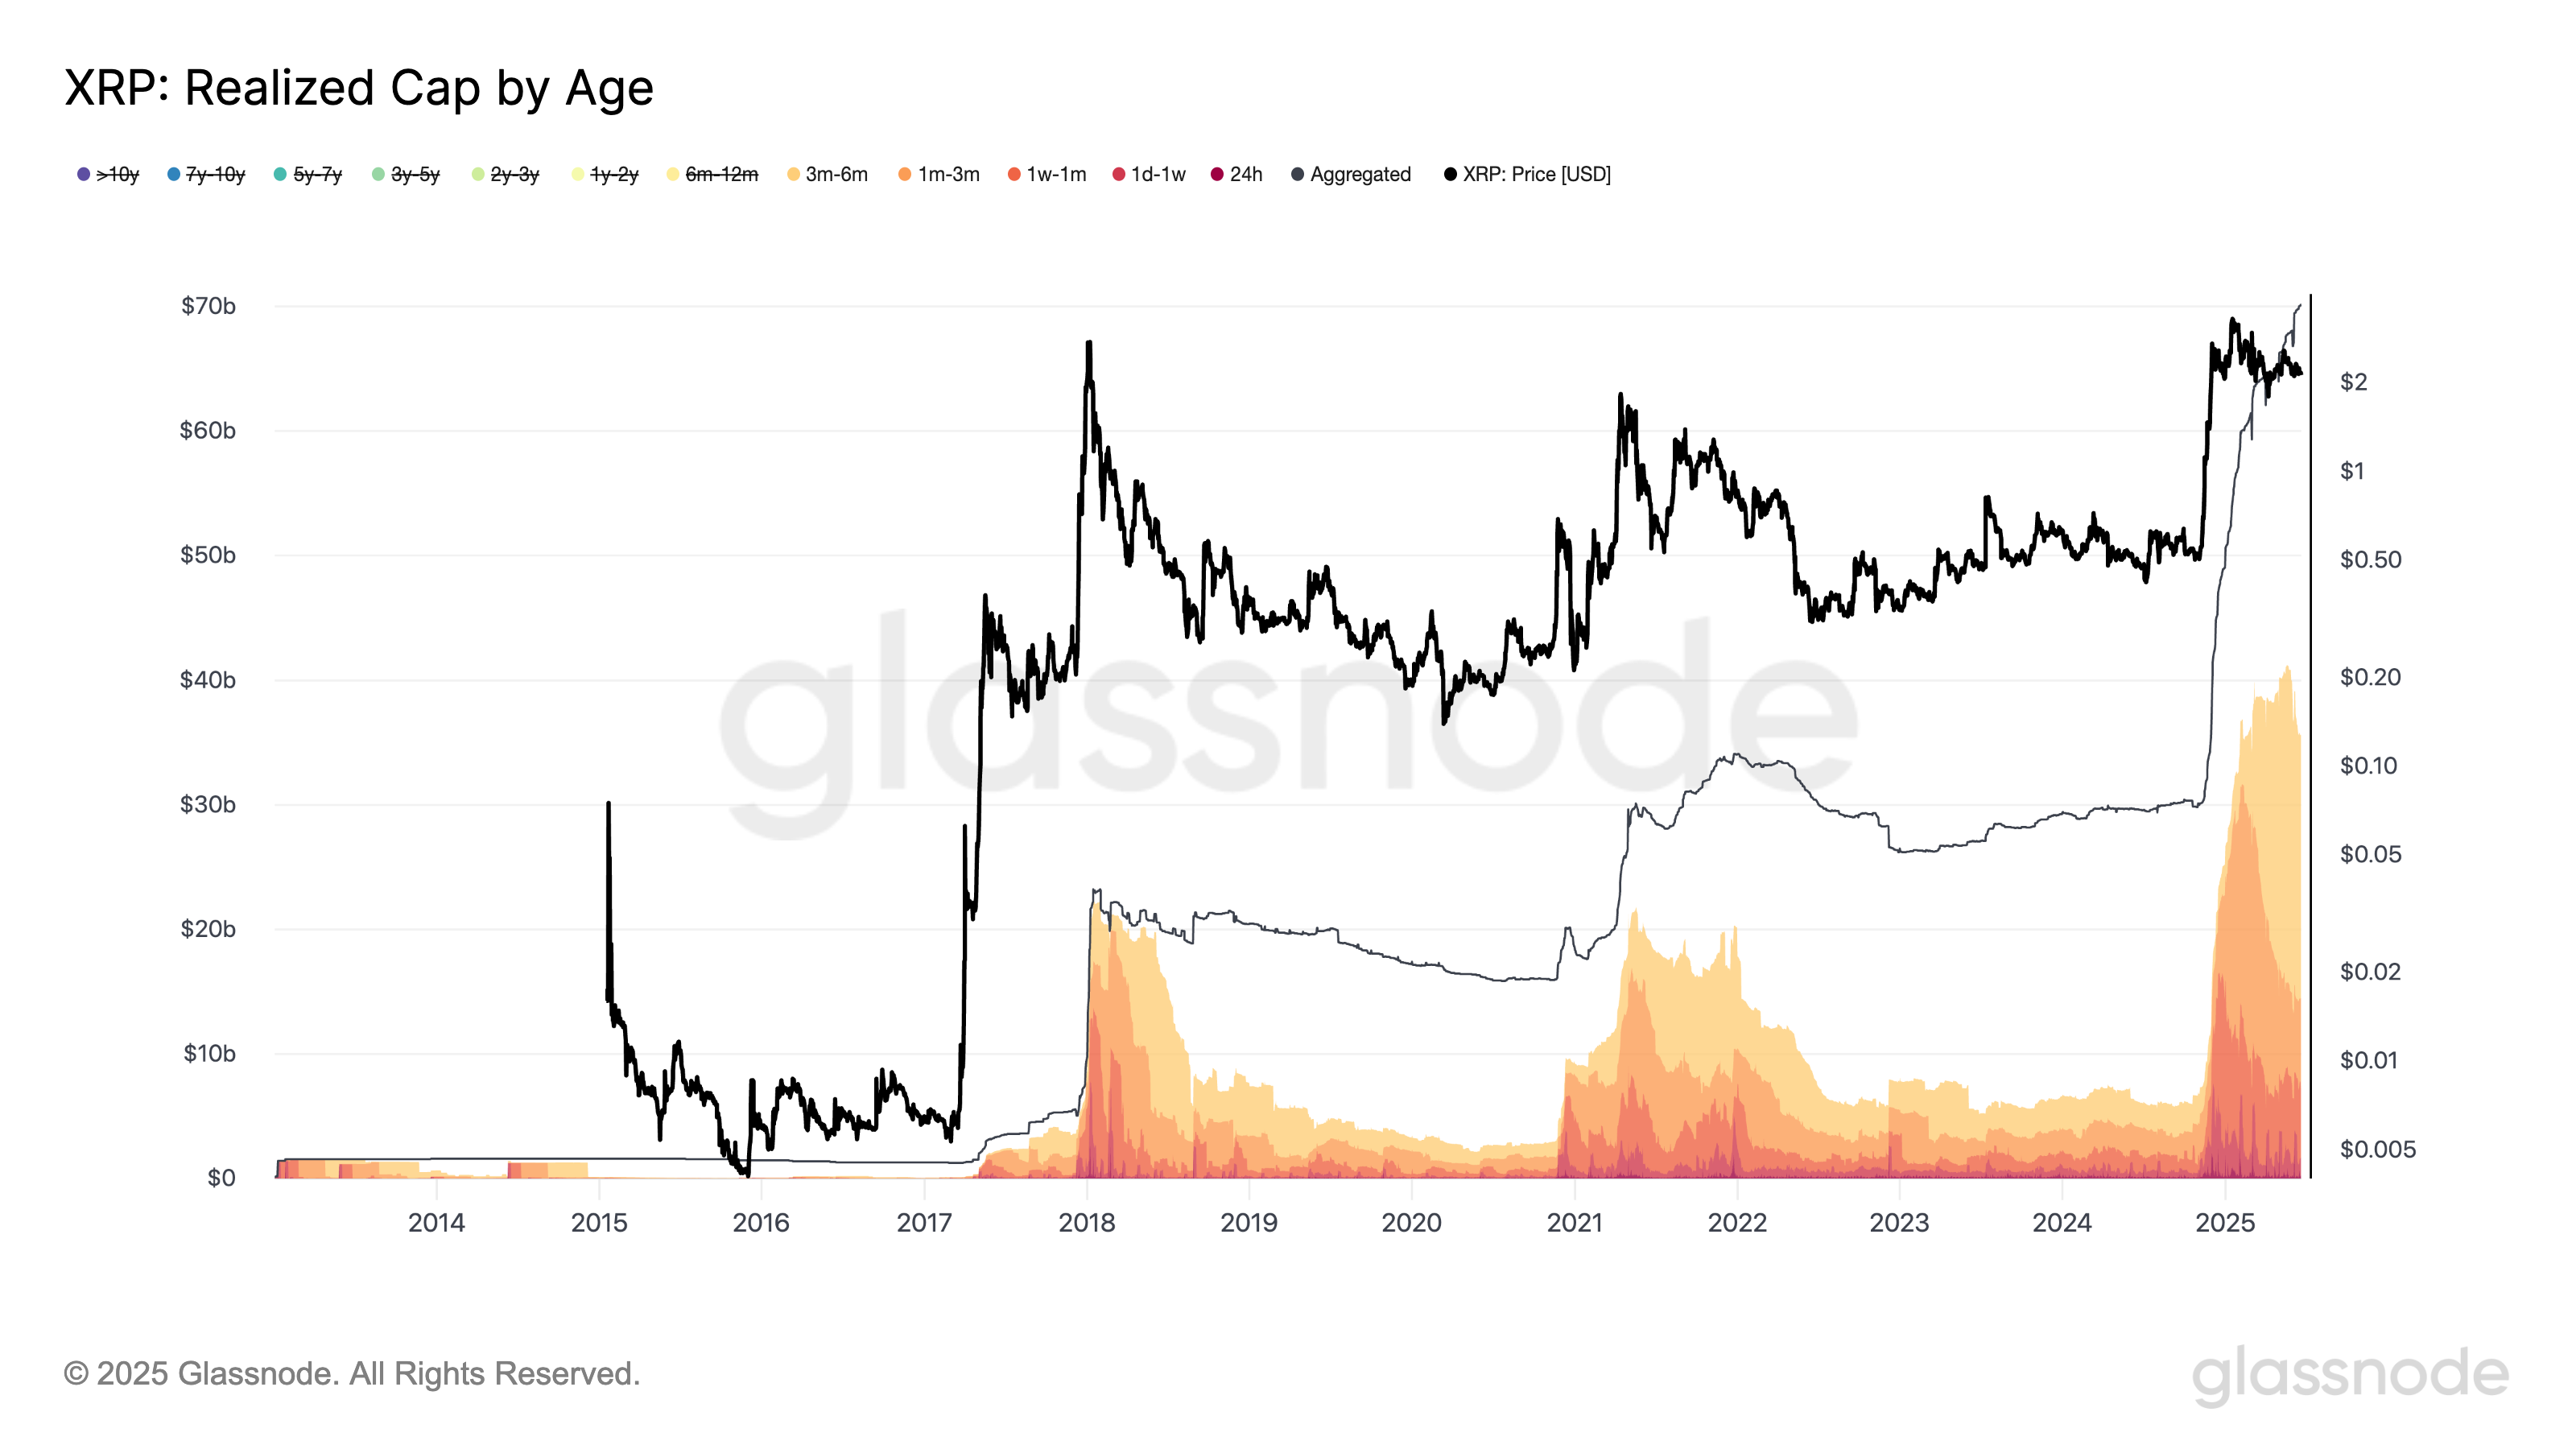
This means the market is now heavily concentrated in newer holders, creating a top-heavy structure that is historically prone to sharper sell-offs during volatility.
XRP’s SOPR, realized price raises 35% decline risk
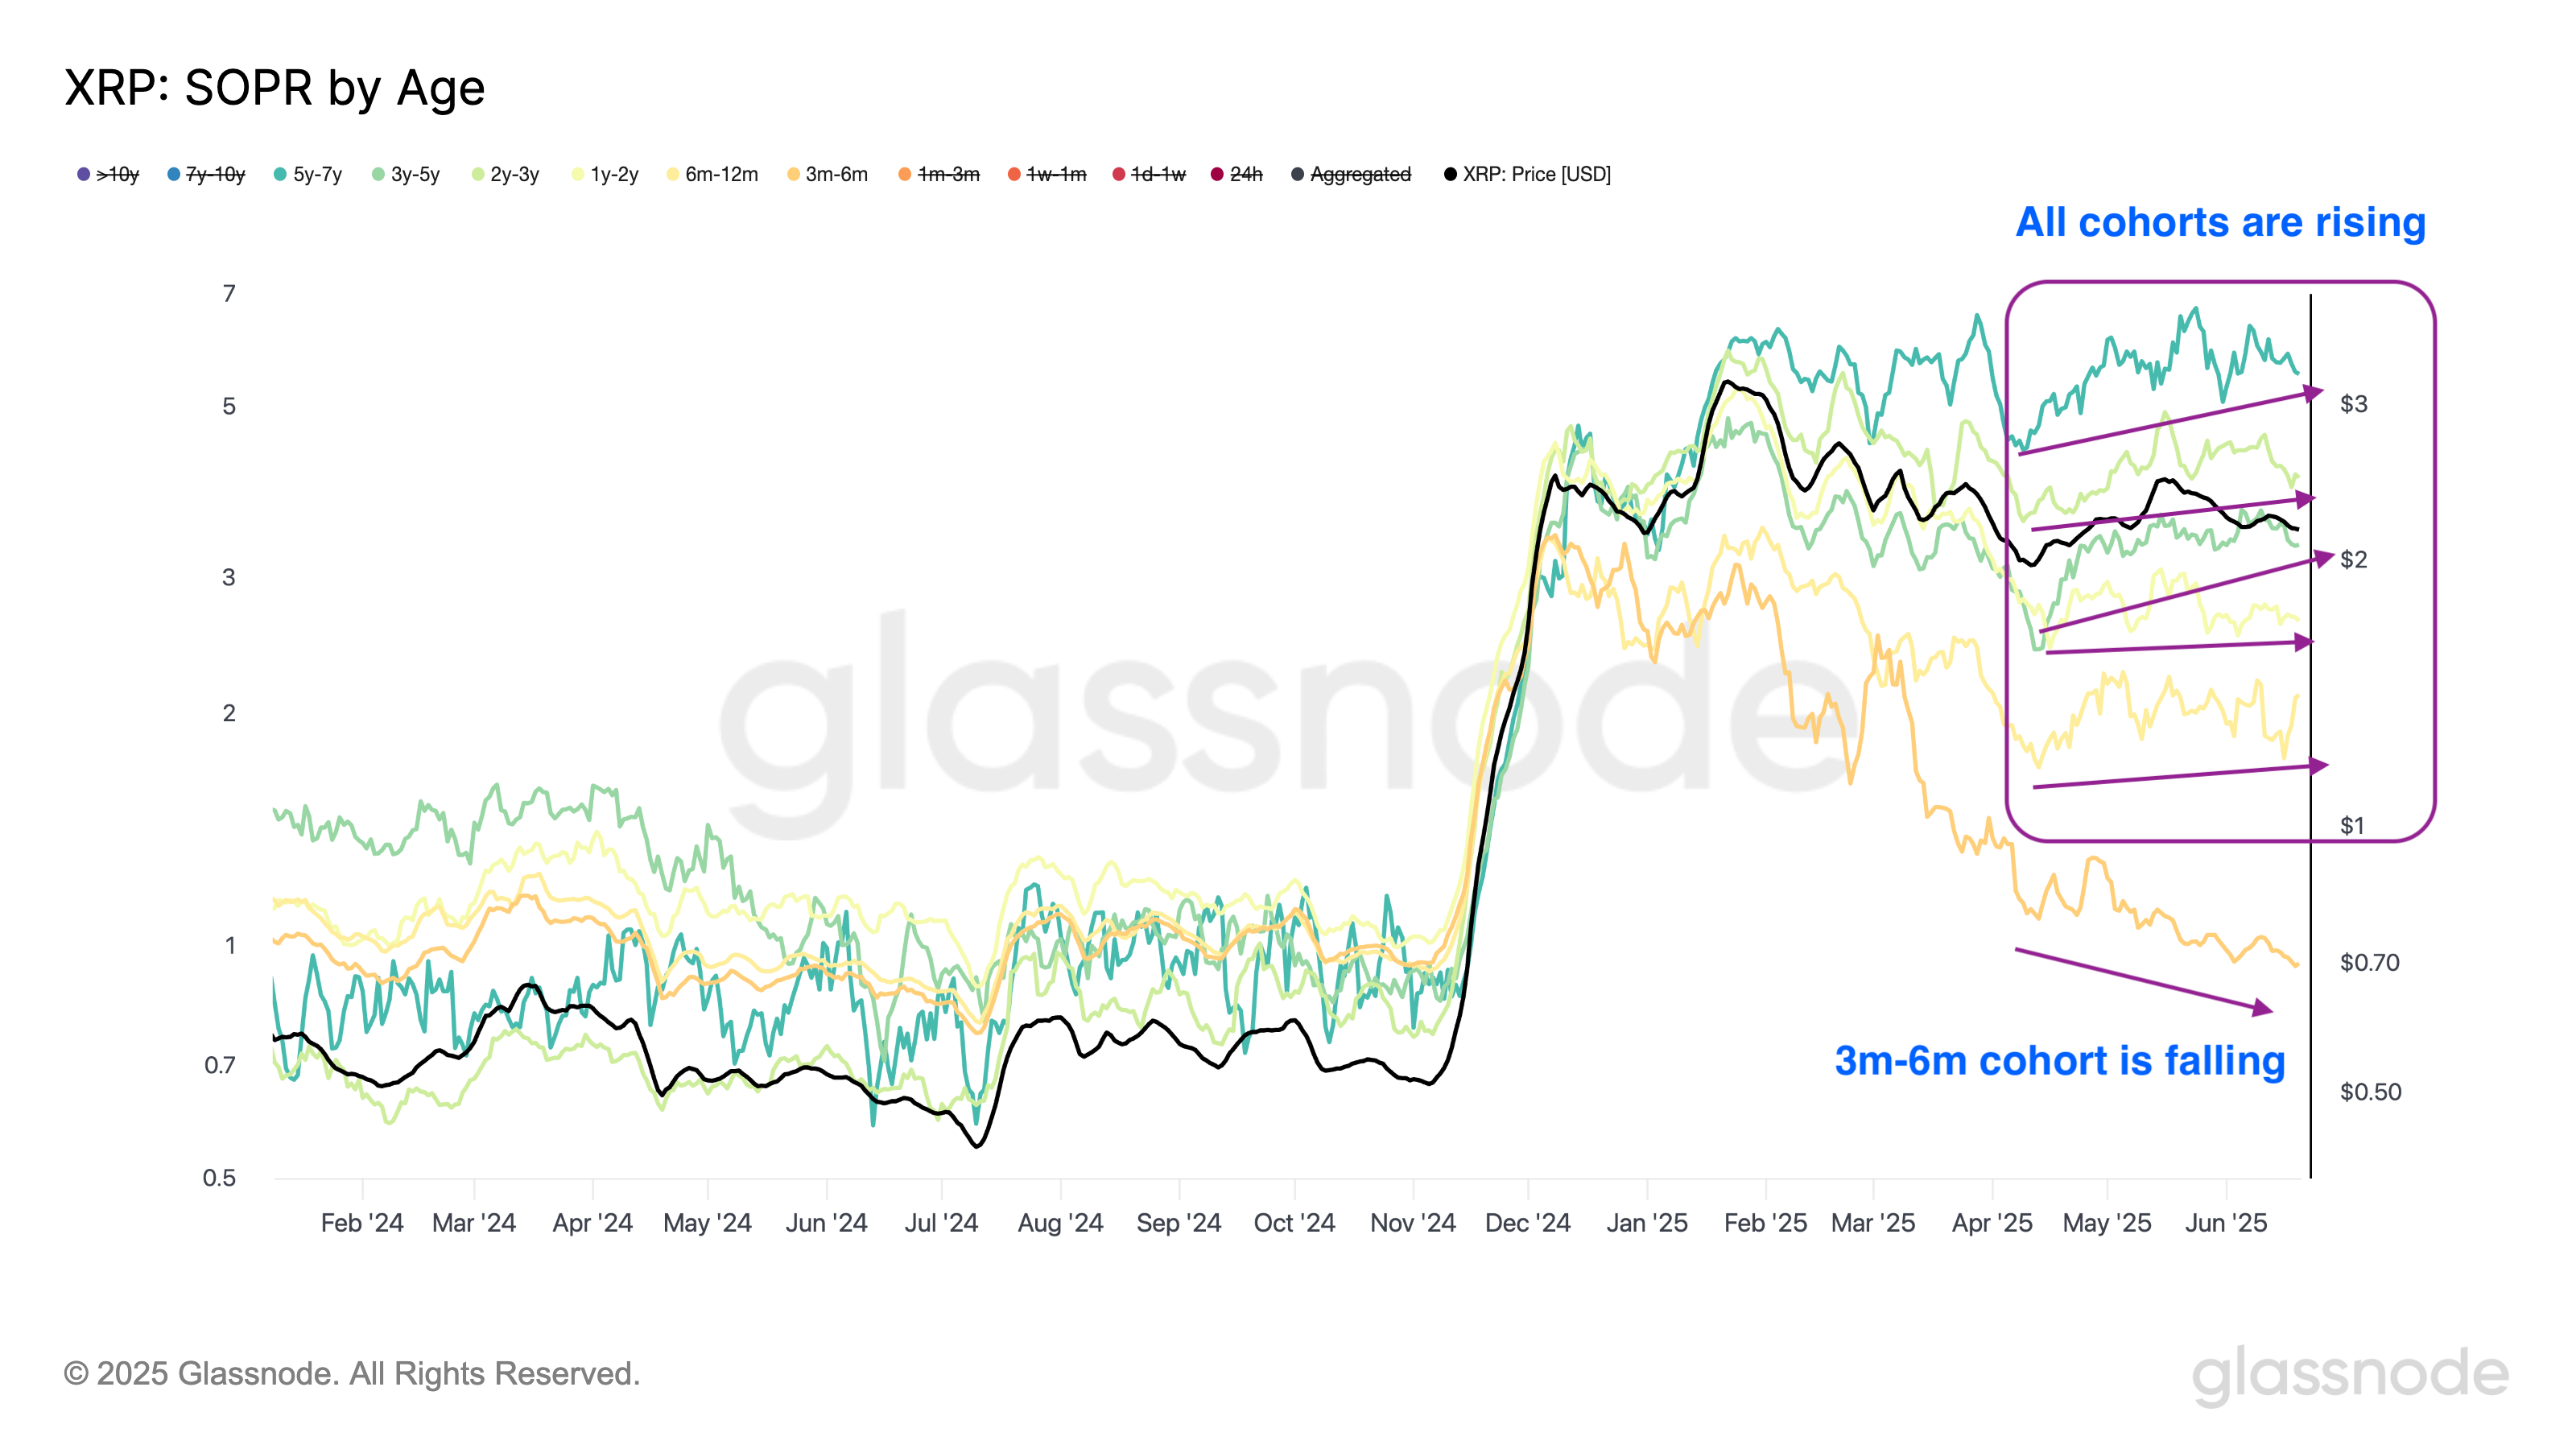
Holders of 3m–6m XRP—those who bought after the November rally—have seen their SOPR (Spent Output Profit Ratio) fall steadily, while other groups began to recover or stabilize in April.
SOPR tracks whether coins are being sold at a profit or loss.
As of June 21, the average buy price for the 3m–6m cohort was $2.28, and $1.35 for the 6m–12m group.
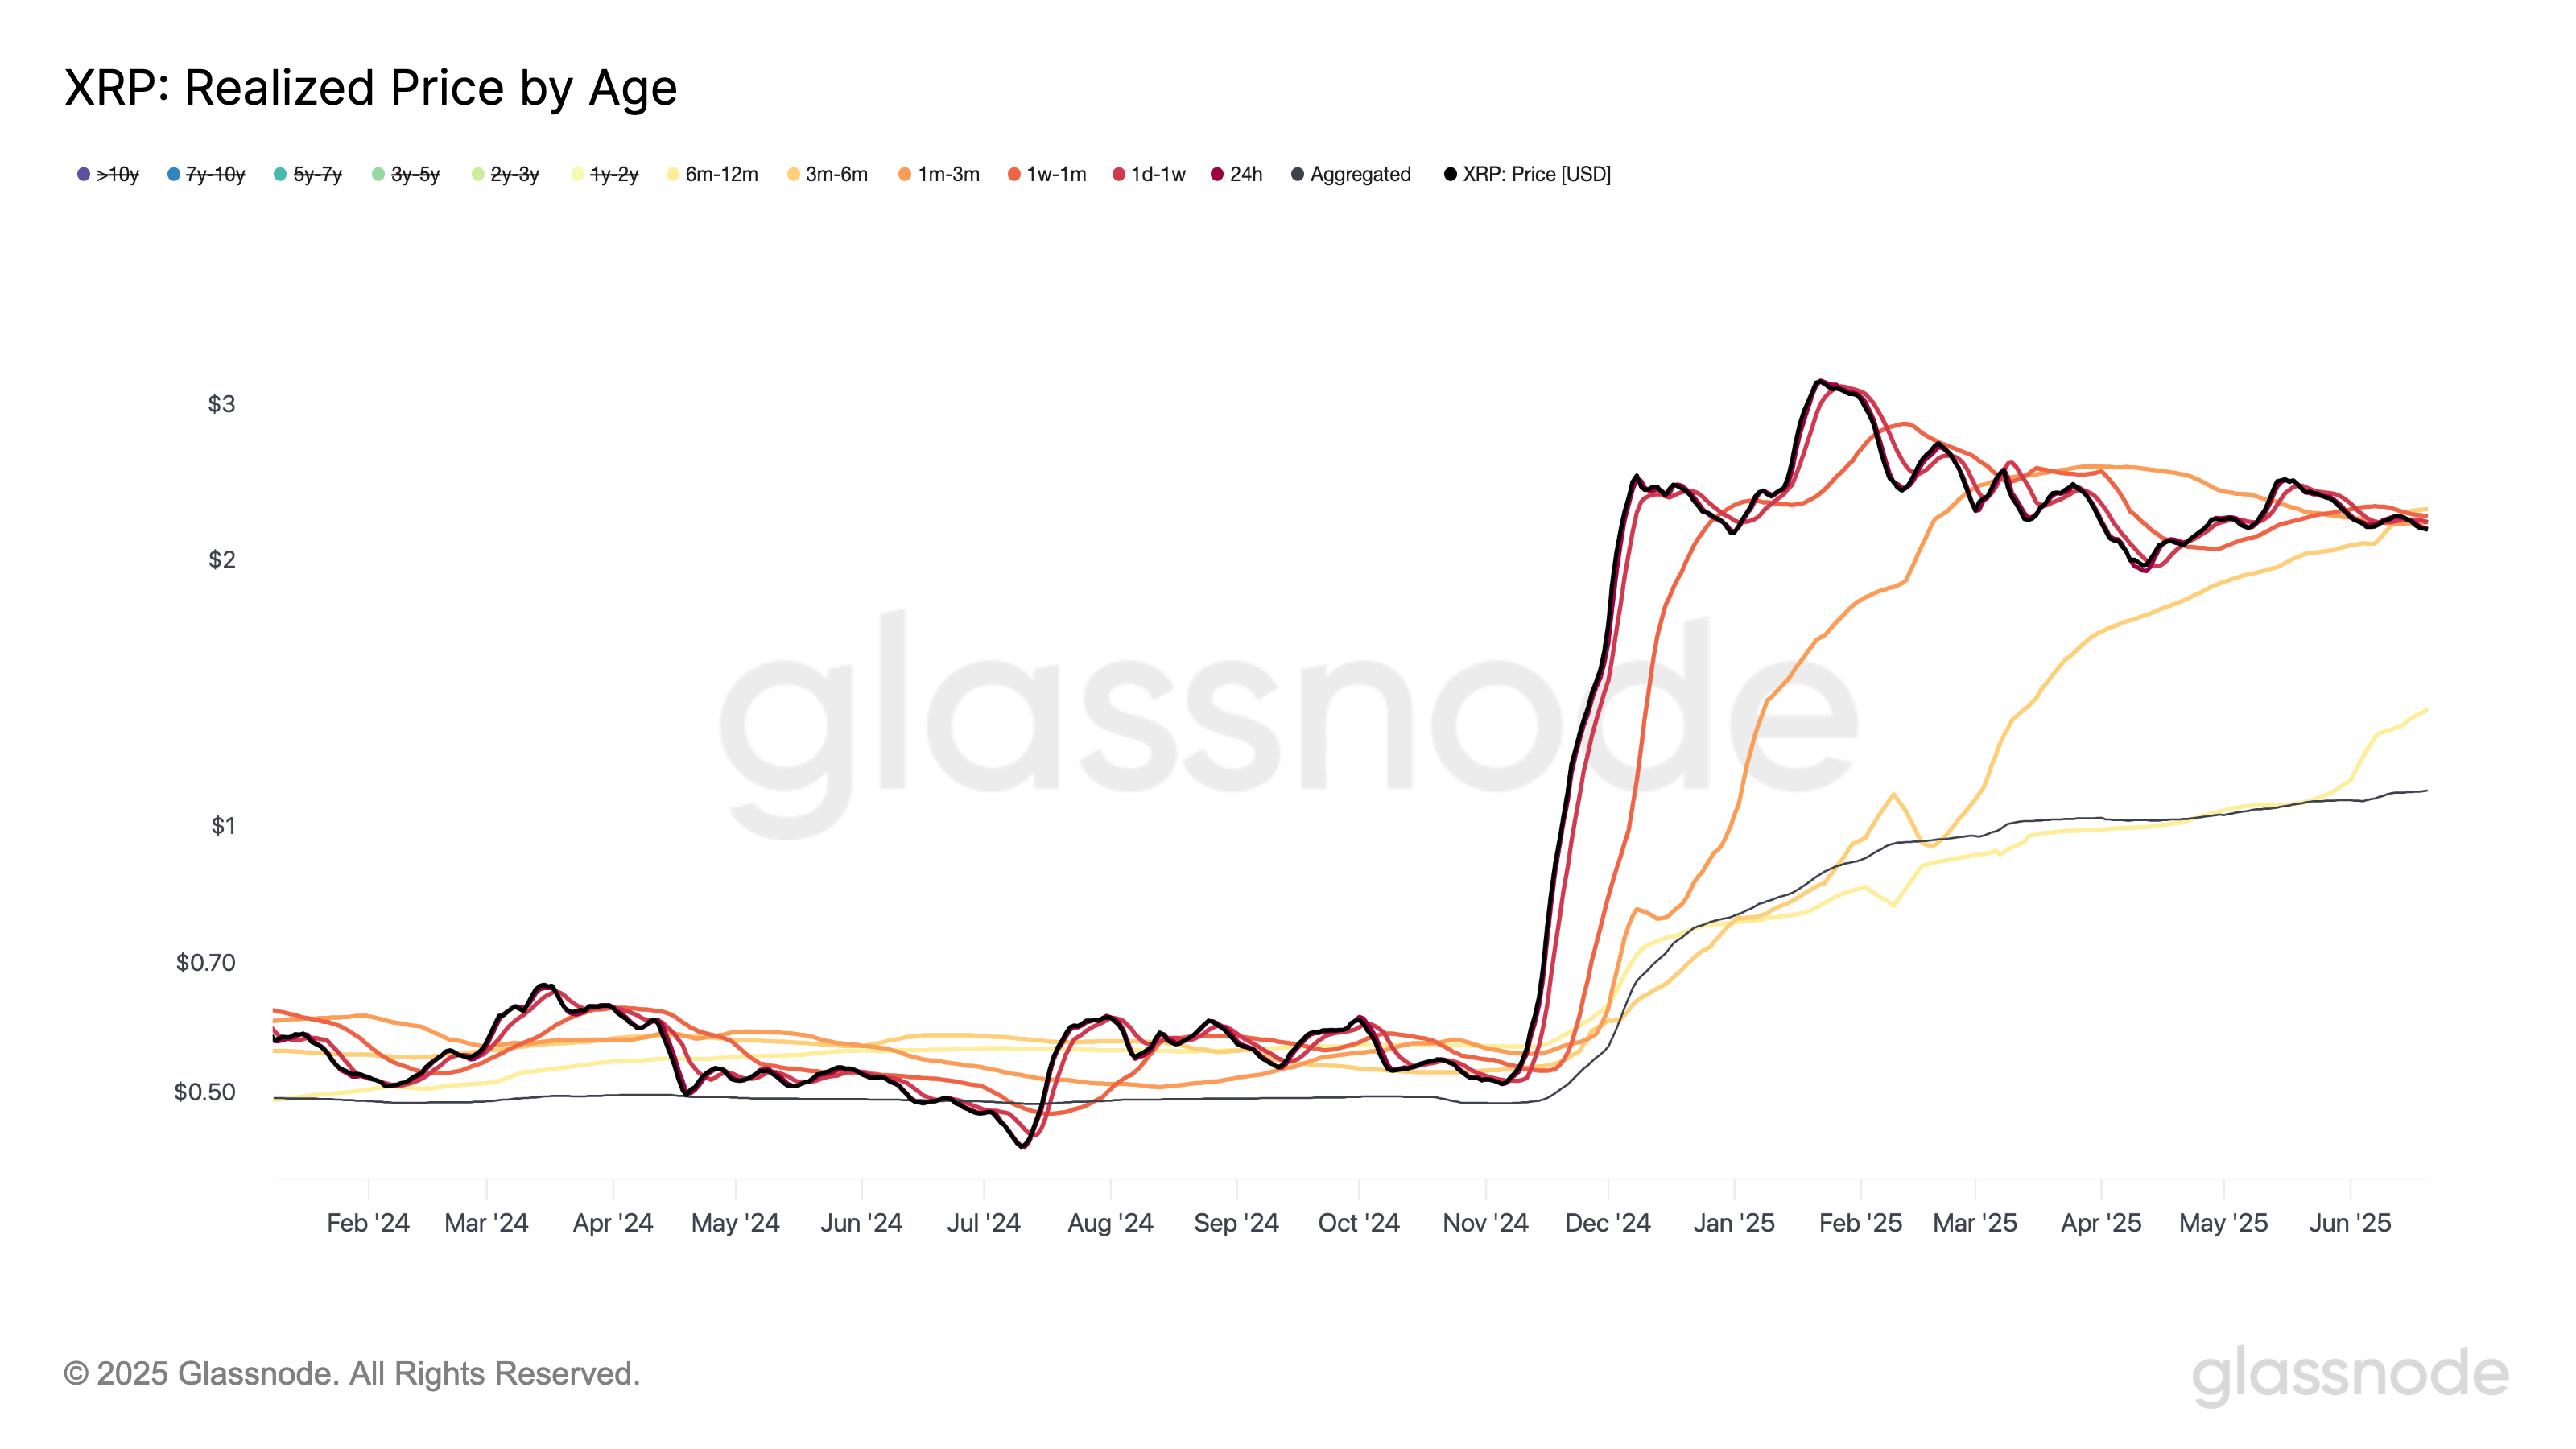
With XRP trading near $2.14, newer holders are barely breaking even, while the 6m–12m cohort still has about a 35% downside cushion before reaching their breakeven level.
In such a scenario, XRP may decline toward the $1.50–$1.60 range, and possibly retest the $1.35 level, where 6m–12m holders would also start to face breakeven pressure.
Related: XRP onchain data shows why $3 is out of reach for now
The realized price is near the floor at $1.30, the downside target suggested by XRP’s descending triangle, which is considered a bearish reversal pattern when formed during an uptrend.
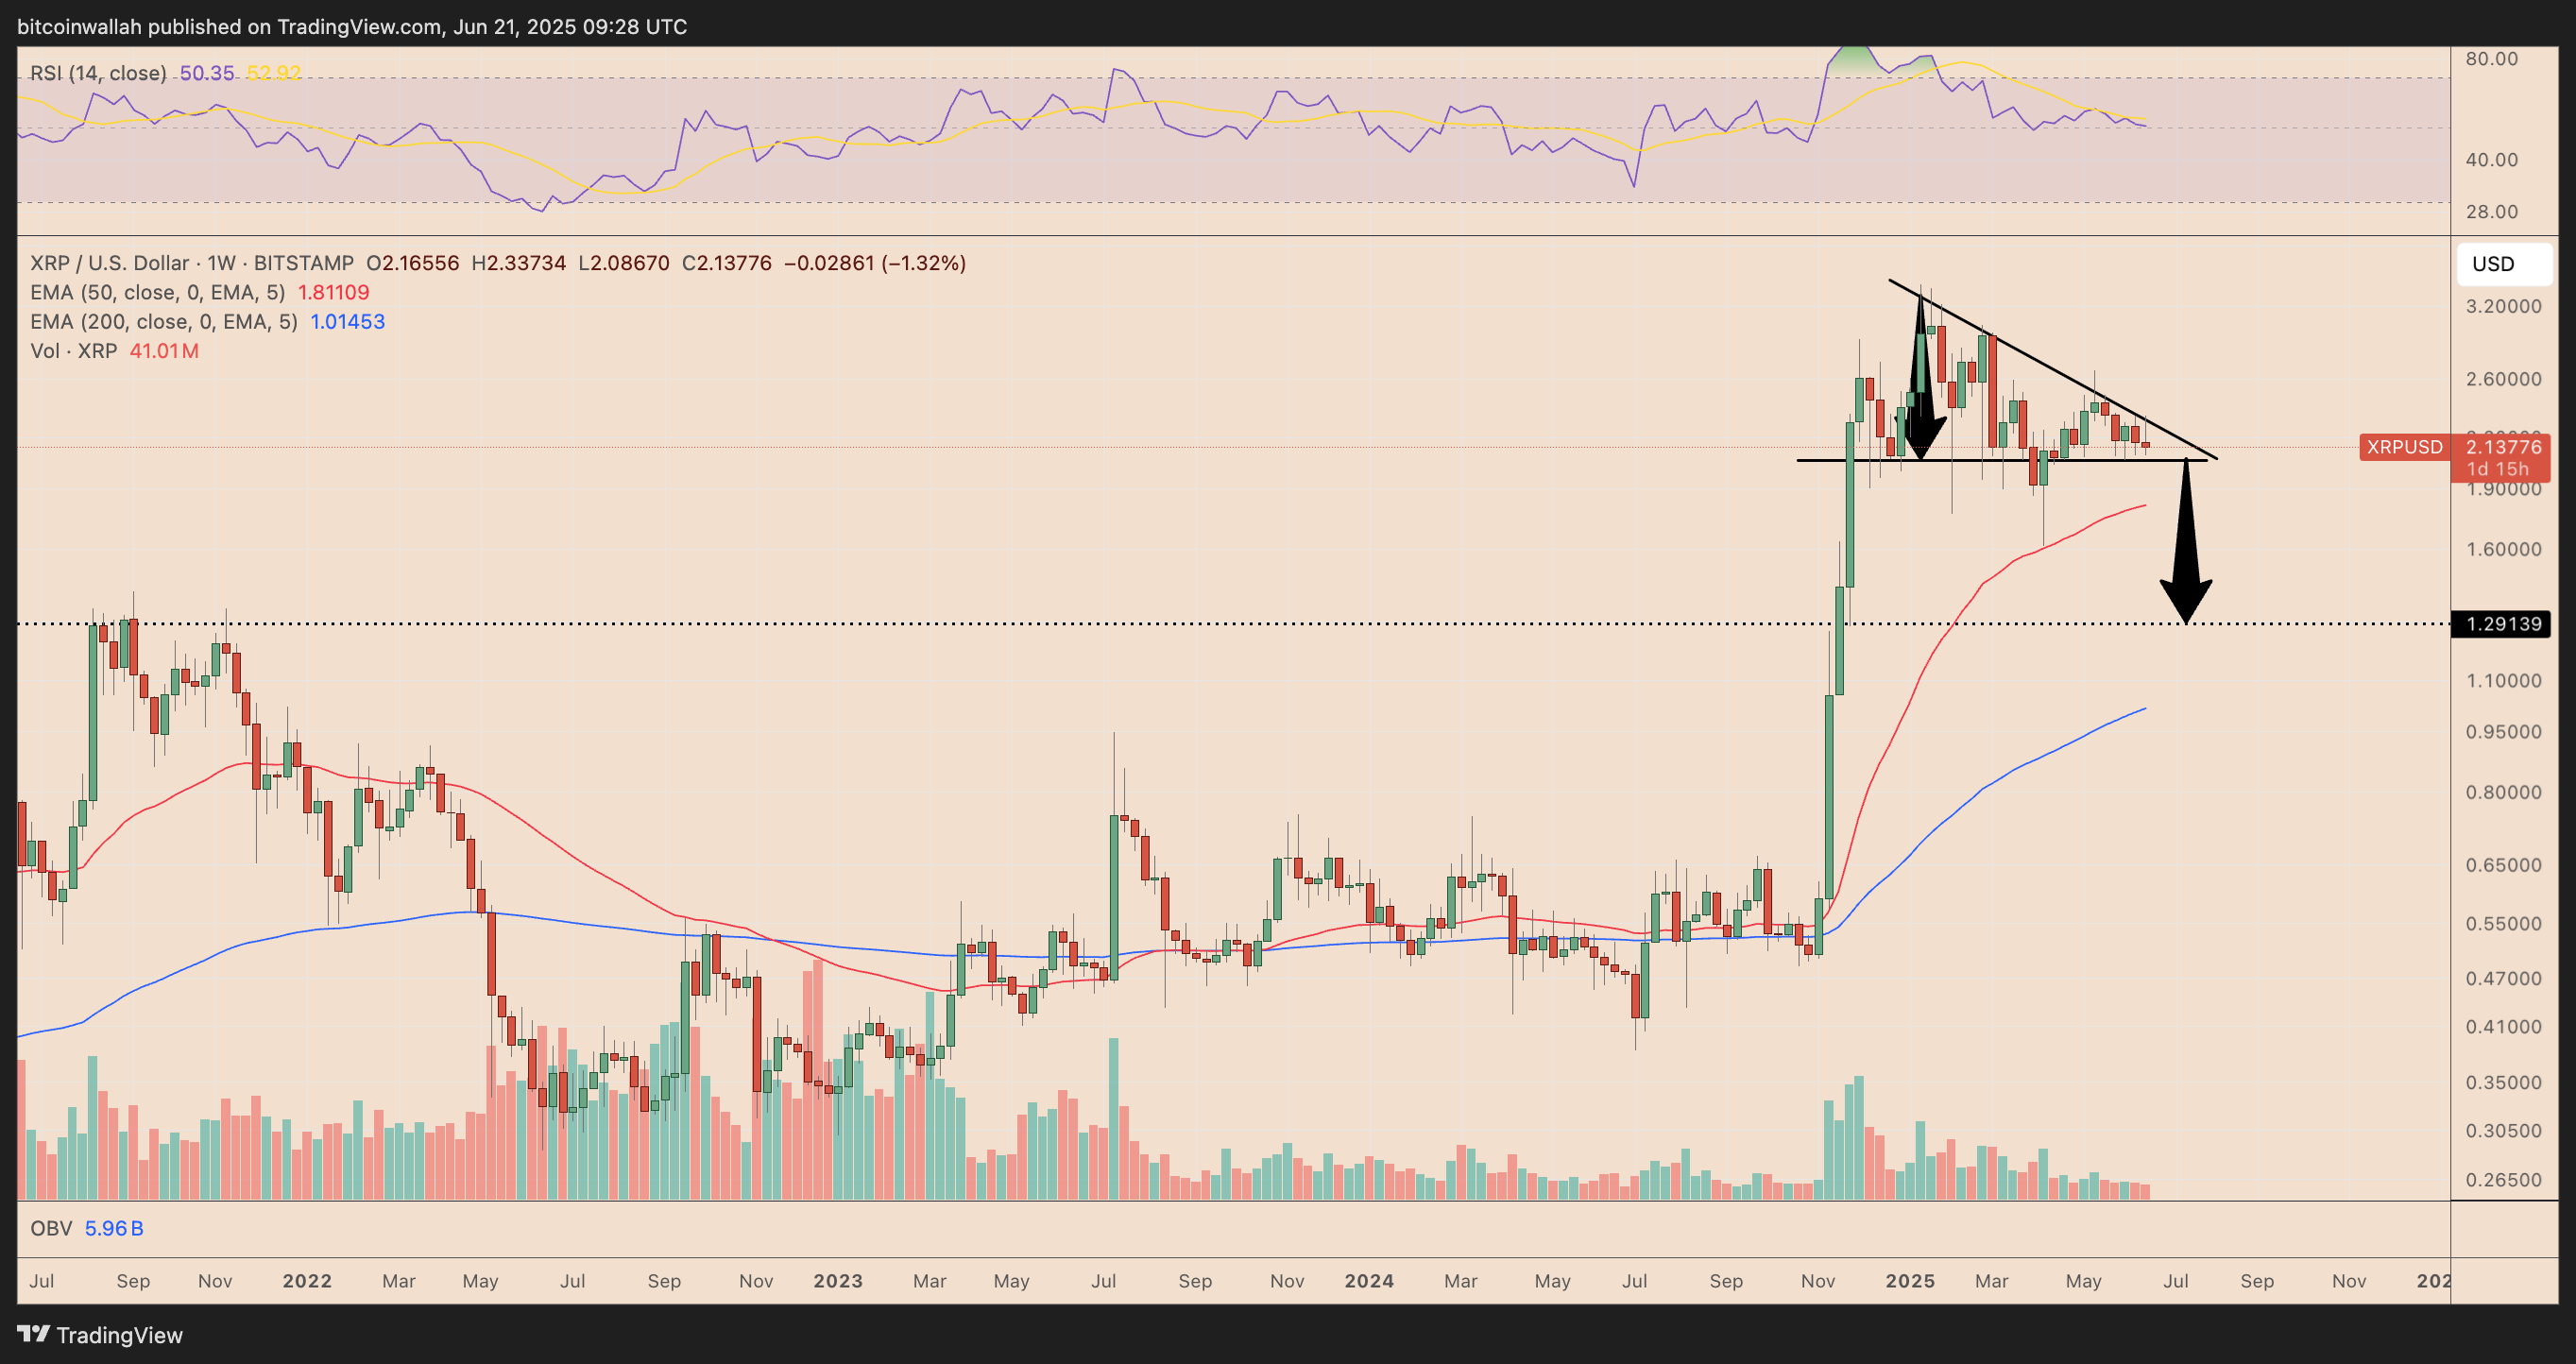
Alternatively, a decisive bounce from the 50-week exponential moving average (50-week EMA; the red wave) could invalidate the downside setup, enabling XRP for a climb toward $3 or above.
This article does not contain investment advice or recommendations. Every investment and trading move involves risk, and readers should conduct their own research when making a decision.
Read the full article here


