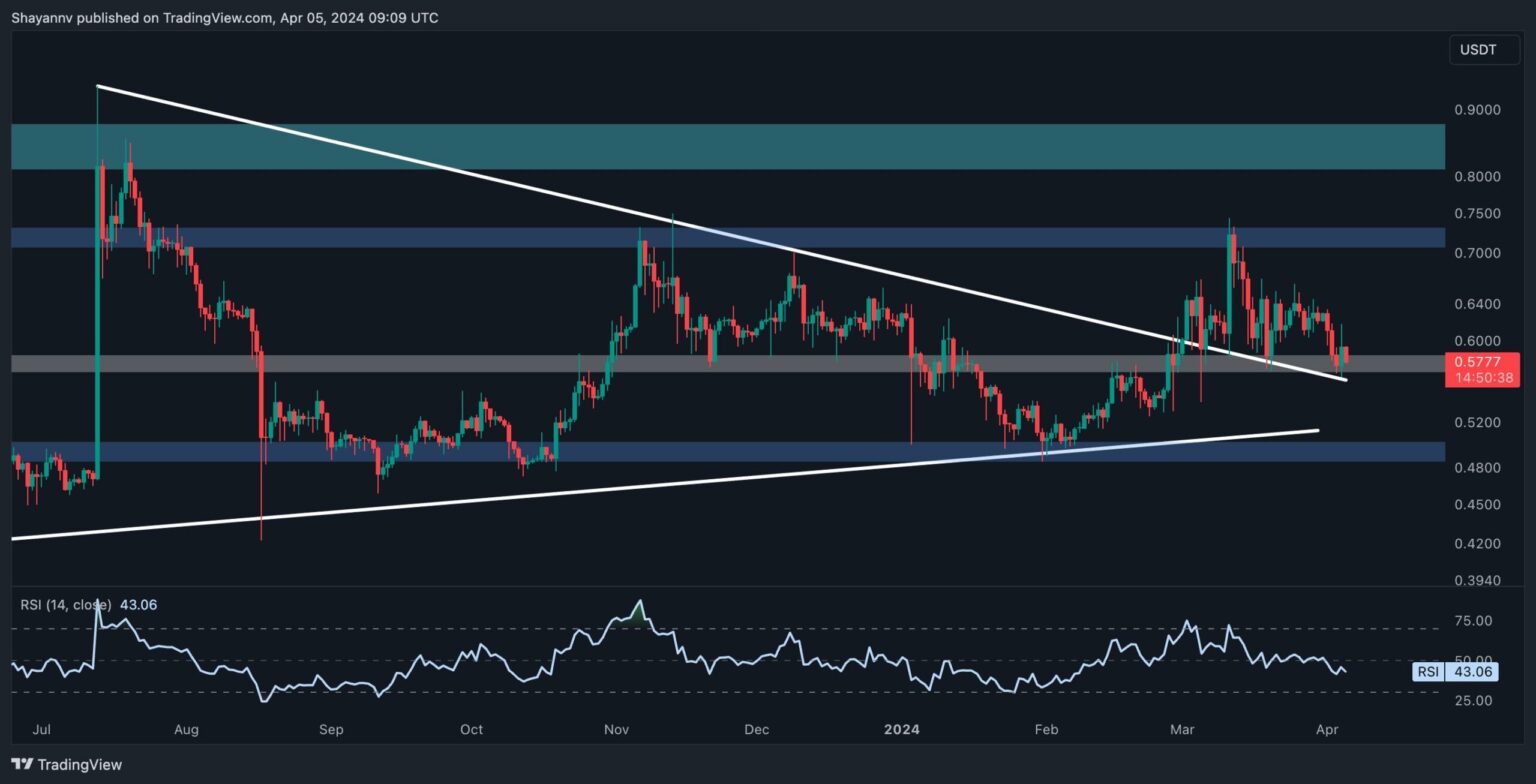
Ripple’s price has recently found itself resting on a significant support area, spanning from $0.58 to the dynamic support provided by the upper boundary of the triangle formation. This critical support zone is anticipated to hinder further downward pressure, setting the stage for a noteworthy rebound in the mid-term.
By Shayan
The Daily Chart
Upon thorough examination of the daily chart, it’s apparent that XRP experienced a notable plunge recently, ultimately landing on a pivotal support region encompassing the $0.57 mark and bolstered by the dynamic support of the triangle’s upper boundary.
Consequently, a reversal is expected as intensified buying pressure nears this crucial level, propelling the price toward the critical resistance at $0.66. Nonetheless, Ripple’s long-term trajectory appears to be consolidating within a decisive range, with $0.7 acting as a crucial resistance and $0.6 as a significant support until a breakout transpires.
The 4-Hour Chart
A closer examination of the 4-hour chart reveals price fluctuations within the pivotal range between $0.57 support and $0.66 resistance, with the recent price descent nearing the lower boundary of this range.
Additionally, the price has recently breached the crucial multi-month ascending trendline due to the downturn and has completed a pullback to the broken level. This action suggests sellers are inclined to drive Ripple’s price towards lower levels.
However, XRP still encounters a crucial support area at $0.57, and a successful breach below this pivotal support could potentially trigger an extended bearish trend toward the $0.55 support zone. Nevertheless, if buying pressure materializes around the $0.57 range and supports the price, a rebound toward the $0.66 resistance is deemed imminent.
Read the full article here

