


XRP price has been trading above $2.20 for the past two days, with its volume up 14% in the last 24 hours, reaching $3 billion. This significant increase in trading activity has brought several key technical indicators into focus, suggesting a pivotal moment for the cryptocurrency.
A potential “golden cross” on its Exponential Moving Average (EMA) lines hints at sustained upward momentum, although critical support levels remain crucial for its continued trajectory.
XRP’s RSI in the Sweet Spot: Potential for Further Movement?
XRP’s Relative Strength Index (RSI) currently stands at 61.6. Over the past two days, it has consistently hovered between 55 and 70.
This places XRP’s momentum within a relatively neutral range, indicating a balance between buying and selling pressures, rather than extreme overbought or oversold conditions.
The Relative Strength Index (RSI) is a momentum oscillator. Technical analysts use it to measure the speed and change of price movements. It moves between zero and 100. Traders typically consider an asset “overbought” when its RSI goes above 70.
This suggests its price might be unsustainably high, indicating a coming correction. Conversely, an RSI below 30 points to “oversold” conditions. This implies the asset might be undervalued and ready for an upward rebound.
An RSI of 61.6 for XRP suggests moderate bullish momentum. It is not yet in overbought territory. This indicates potential for further upward movement before a correction might be expected.
Is a Stronger Trend Developing?
XRP’s Ichimoku Cloud chart presents a bullish picture. The price candles rank above the red and blue lines, indicating a generally upward trend.
The red line, also known as the Tenkan-sen, and the blue line, or Kijun-sen, both show a bullish alignment.
This means the faster-moving Tenkan-sen is above the slower-moving Kijun-sen, often signaling positive momentum in the short to medium term.

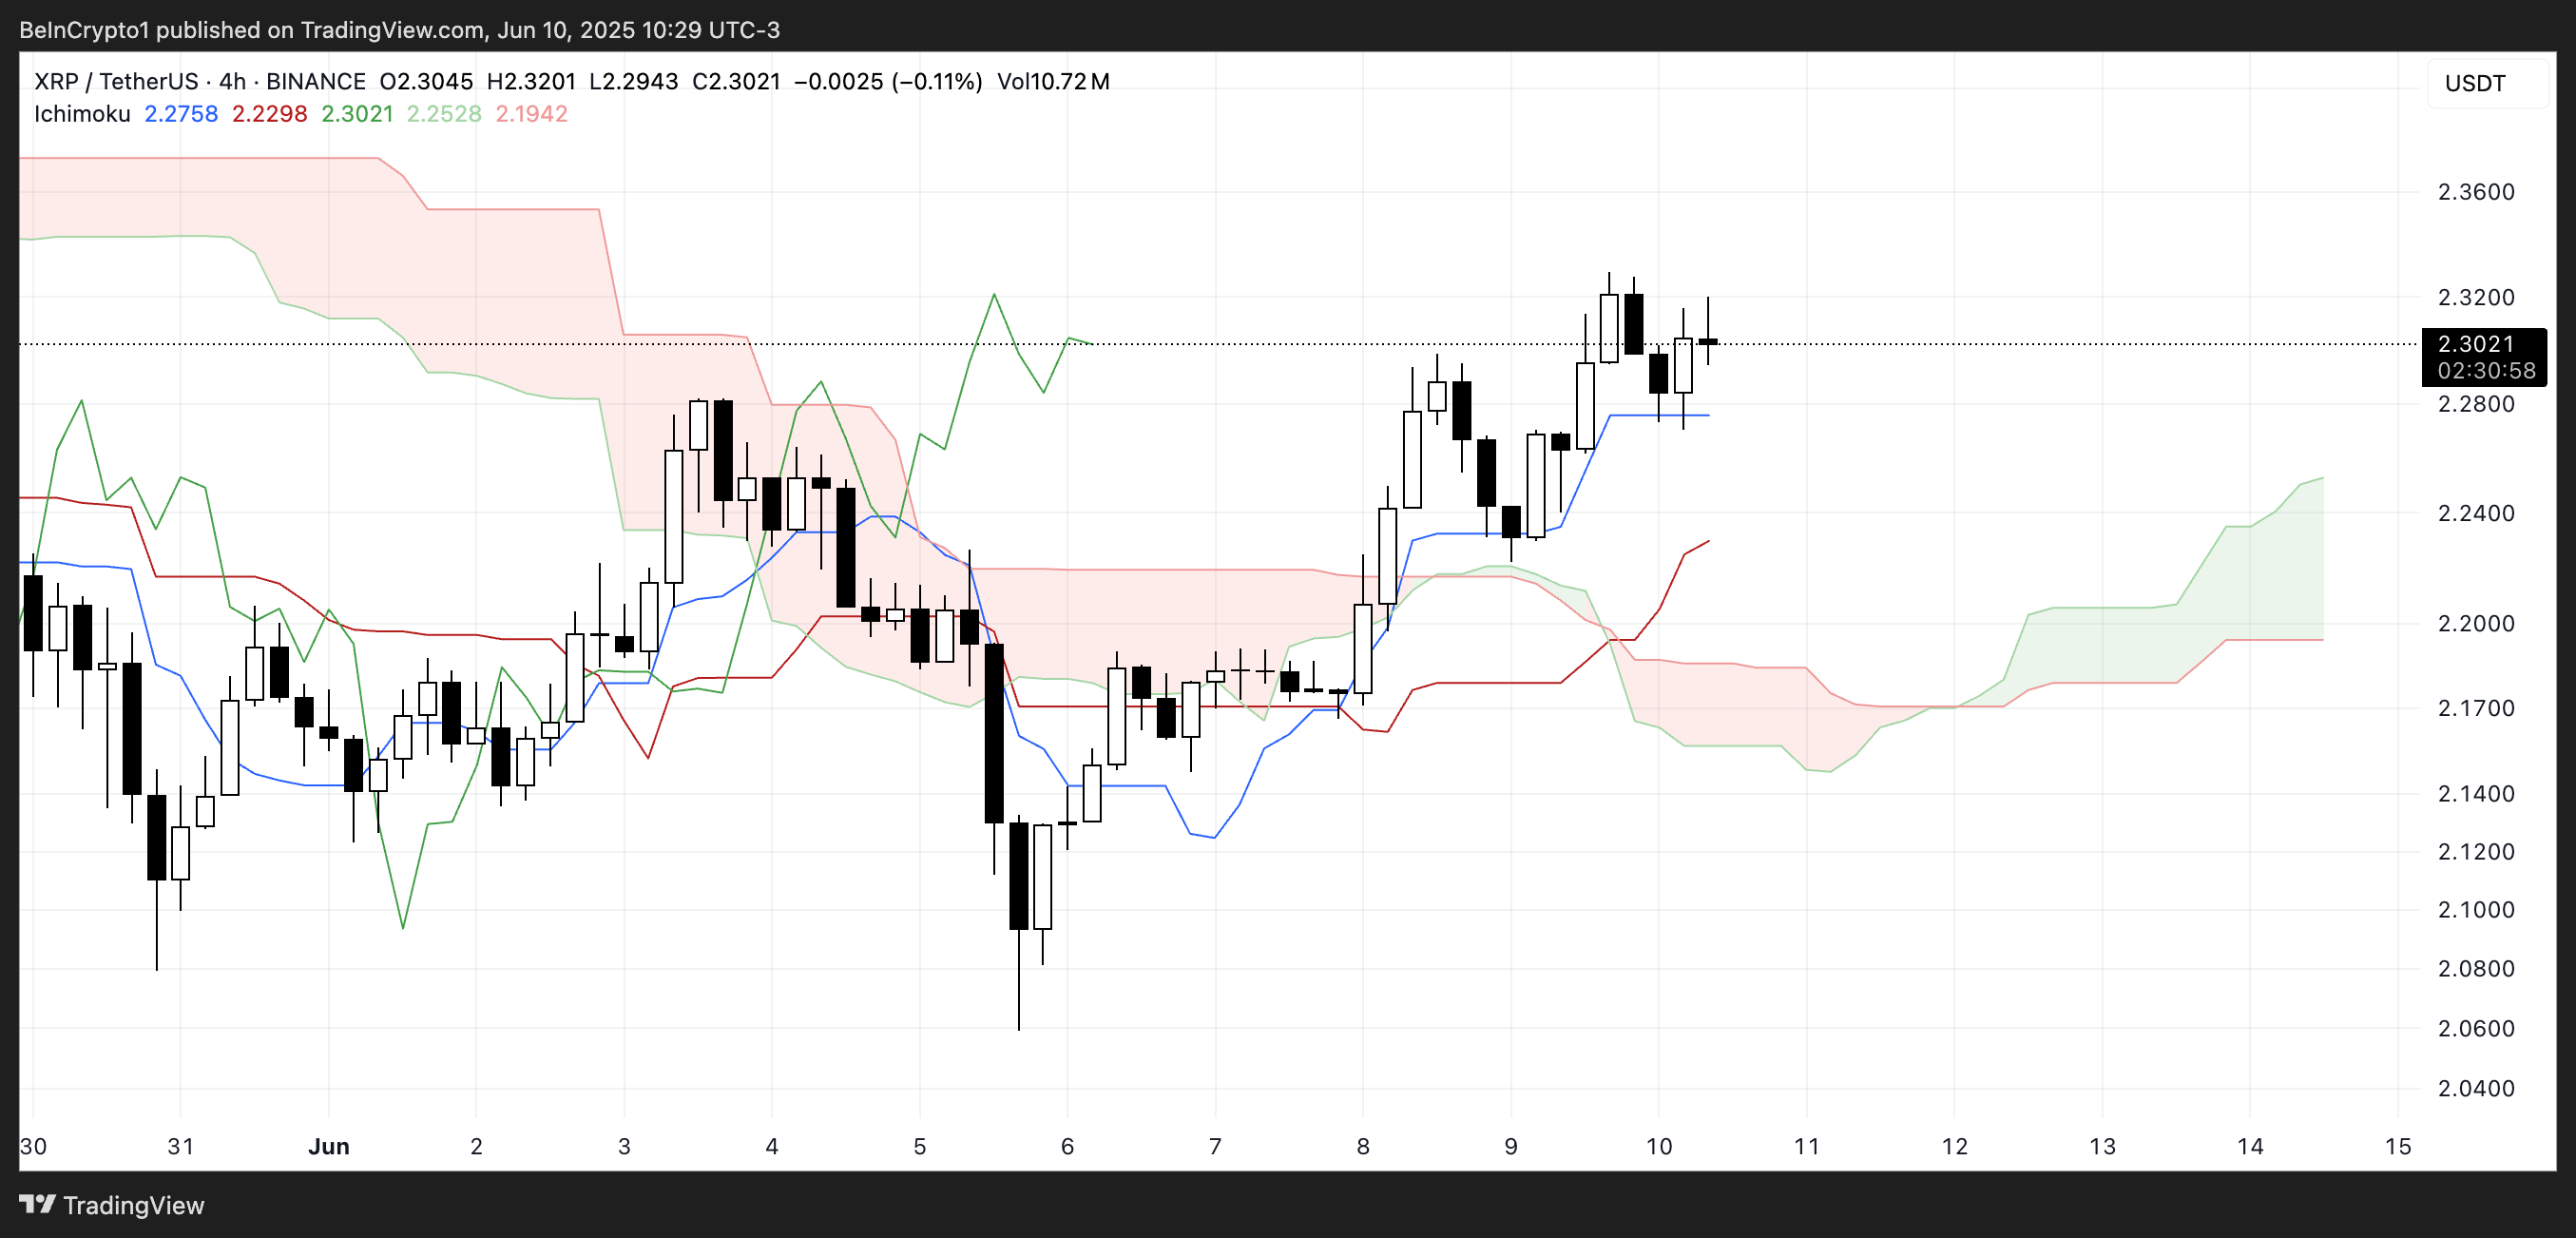
Looking at the Ichimoku Cloud itself, which is formed by the Senkou Span A and Senkou Span B, the current and future clouds show varying shades. The immediate cloud above the price is green, suggesting an ongoing bullish sentiment.
The projection for the cloud further into the future also appears to be turning green, reinforcing the potential for continued upward movement.
The thickness and direction of the cloud can also provide insights into the strength and future direction of the trend, with a rising and thick green cloud often indicating strong support for an uptrend.
XRP Eyes Golden Cross: Potential Breakout Towards $2.65
XRP’s Exponential Moving Average (EMA) lines suggest a significant development: a new golden cross could form soon. XRP might test and break the resistance level at $2.35 if this bullish signal materializes.
A strong uptrend following this breakout could push the price higher, potentially reaching $2.47, and even $2.65 if the upward momentum remains strong.
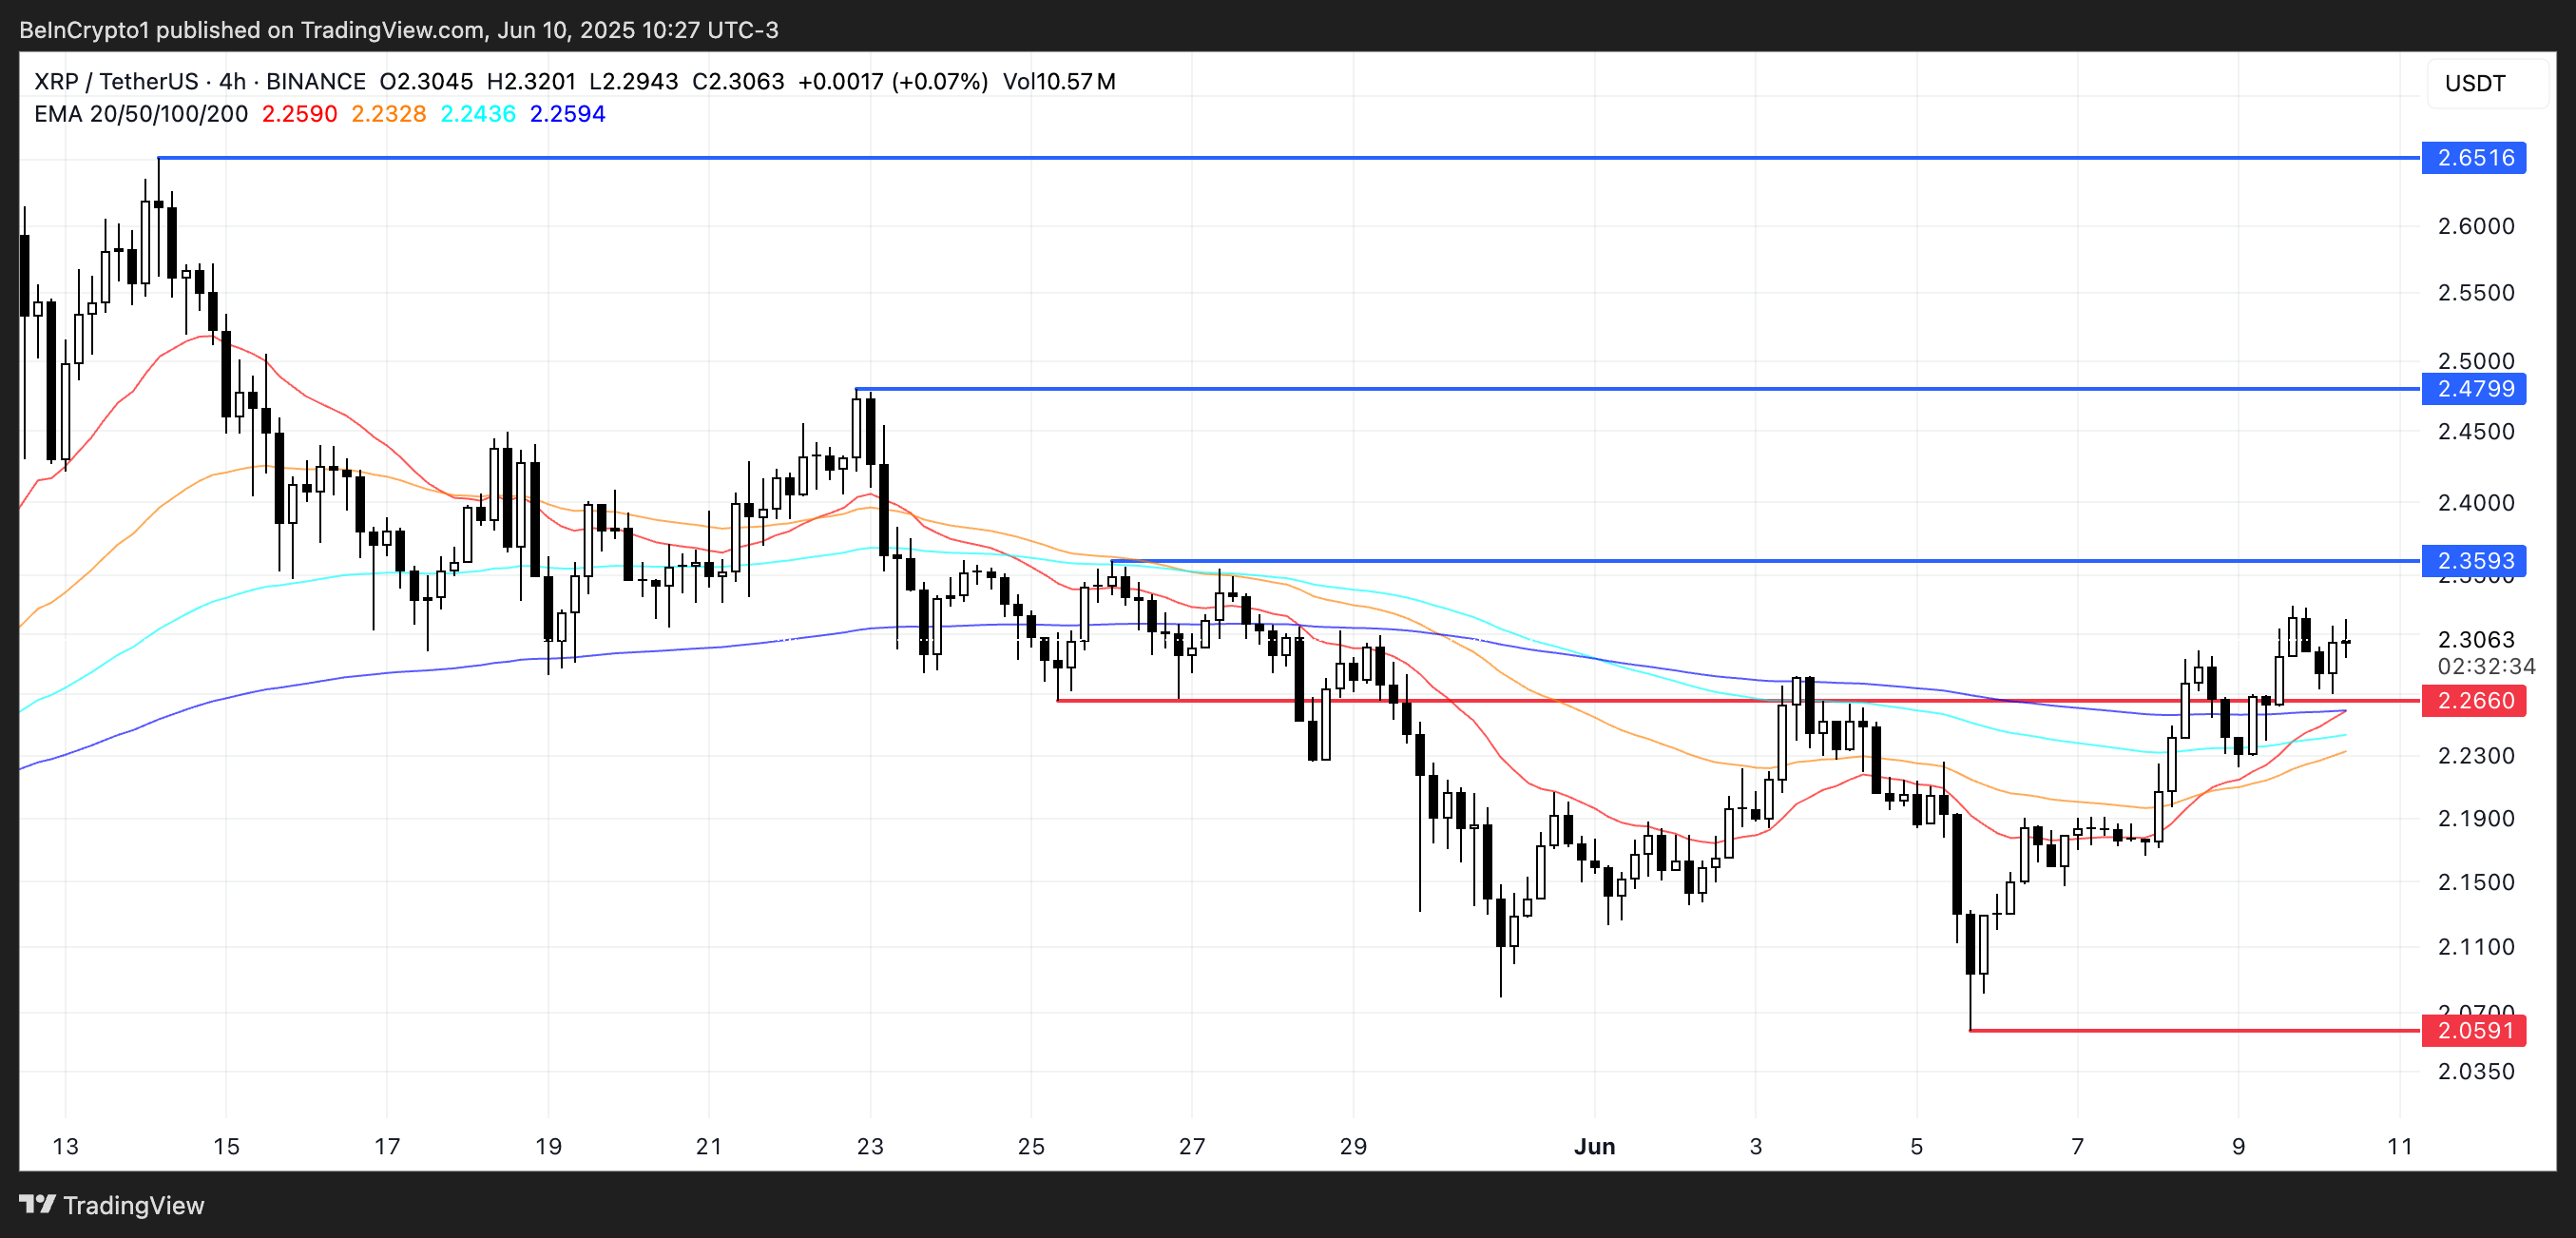
Conversely, XRP faces a critical support level at $2.26.
If this support is tested and fails to hold, XRP could experience a notable downturn. A breach of this level might send XRP’s price down to $2.05.
Disclaimer
In line with the Trust Project guidelines, this price analysis article is for informational purposes only and should not be considered financial or investment advice. BeInCrypto is committed to accurate, unbiased reporting, but market conditions are subject to change without notice. Always conduct your own research and consult with a professional before making any financial decisions. Please note that our Terms and Conditions, Privacy Policy, and Disclaimers have been updated.
Read the full article here


