


 Golden Bull Run Incoming? Solana (SOL) Enters Freefall, Bitcoin (BTC): Now or Never?")


The crypto market’s volatility in April resulted in Bitcoin and many altcoins witnessing considerable growth.
However, some altcoins missed this opportunity but are preparing to do so in May. BeInCrypto has prepared this analysis to put the spotlight on lesser-known coins that are poised for gains in the coming month.
Eyes on Theta Network (THETA)
Theta Fuel (THETA) price has witnessed nothing but a drawdown throughout April and the second half of March. The altcoin fell from $3.4 to $1.9, marking a 42% correction. Consequently, the altcoin fell into a descending broadening pattern known to be bearish.
However, the Moving Average Convergence Divergence (MACD) indicator suggests differently. MACD is a trend-following momentum indicator that shows the relationship between two moving averages of a security’s price. It helps identify potential buy and sell signals based on crossovers and divergences between these moving averages.
The indicator has only observed bearishness for the past month, which flipped this week as the MACD witnessed a bullish crossover. This will likely initiate the uptrend on the daily chart, which could help THETA break out of the descending broadening pattern to flip $3 into support.
THETA/USDT 1-day chart. Source: TradingView
However, if the breach of the upper trend line fails, the altcoin could see a fall back to the lower trend line. As the pattern suggests, this would result in a potential downtrend, effectively invalidating the bullish outlook.
Ravencoin (RVN) Is at the Cusp of a Breakout
Ravencoin (RVN) price is attempting recovery from the lows of $0.028 and is now aiming at flipping the 23.6% Fibonacci Retracement of $0.058 to $0.028 into support. Marked at $0.035, doing so would enable the altcoin to bounce off the price level and breach the 38.2% and 50% Fib lines.
Marked at $0.039 and $0.043, respectively, breaching them would sustain the rise and push RVN further upwards. The MACD is also at the cusp of noting a bullish crossover with green bars on the histogram. Once this crossover takes place, a potential bullish outcome could be confirmed.
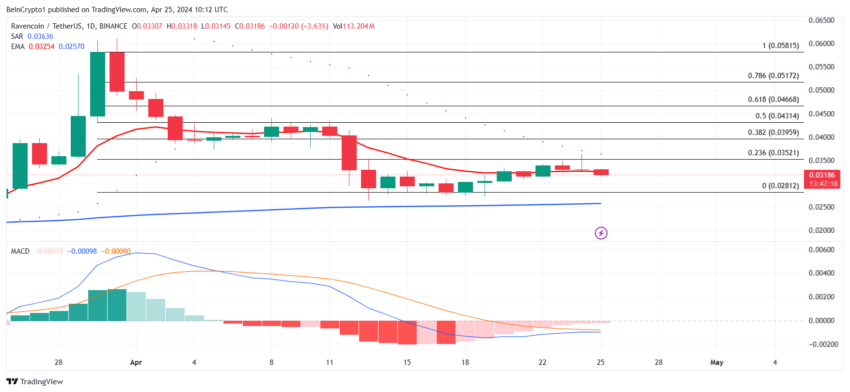
RVN/USDT 1-day chart. Source: TradingView
However, if the 38.2% or 50% Fib levels remain unbreached, RVN could return to the 23.6% Fibonacci line, invalidating the bullish outcome. This might result in a decline to $0.028.
Akash Network (AKT) Is set to Flip Critical Resistance Into Support
Akash Network (AKT) price has been making headlines lately for its Upbit listing and the upcoming summit, which will be the first for the network. This has resulted in AKT posting an almost 74% growth in a single day before retracing the rally down to 25%.
The altcoin is now trading at $4.80, just under the 50% Fibonacci Retracement of $6.25 to $3.44. Closing above this line would enable AKT to breach the 61.8% Fib marked at $5.17. This level is also known as the bull run support floor, as rallies find strength upon branching this line.
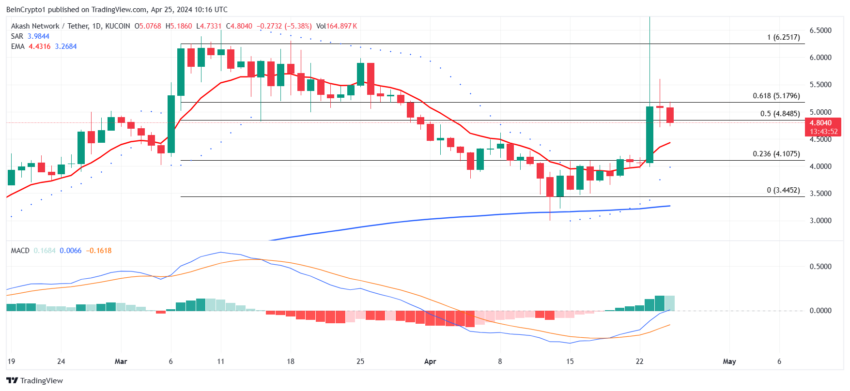
AKT/USDT 1-day chart. Source: TradingView
This could help AKT run up to $5.50 and beyond. However, if the breach fails or the 50% Fib level is not secured as a support floor, it could cause a decline to $4.10, effectively invalidating the bullish outcome.
Read the full article here


