Bitcoin has come a long way from merely being a financial experiment to becoming an important store of value. Currently sitting at a six-figure valuation, the flagship cryptocurrency has amassed a horde of investors who actively profit from its directional movements.
Despite all its growth, Bitcoin’s price action still stands influenced by moments of frenzy, fear, and also caution in investors. At the moment, on-chain data points out that Bitcoin might be at a phase where caution is the order of things. Here are the details of this revelation.
90-Day CVD Shifts To Neutral After Prolonged Trends
In a June 27 post on X, the social media platform, crypto analyst Maartunn revealed that there has been an important shift in an important metric. The relevant indicator here is the 90-day Futures Taker Cumulative Volume Delta (CVD) metric, which tracks the net buying or selling pressure in BTC’s futures market.
A positive and rising value of the metric usually means that the futures market is dominated by the buyers (Taker Buy Dominant). On the other hand, when the indicator is negative, it means that the futures market is being dominated by the short traders (Taker Sell Dominant).Source: @JA_Maartunn on X
In the post on X, Maartunn pointed out that the current 90-day CVD is flat, which indicates a balance between bullish and bearish forces in the market. While the Bitcoin price might have shown good signs of recovery, this piece of on-chain data suggests that the market leader might return to a consolidation range.
Bitcoin Fear And Greed Index At Neutral Levels
In another June 27th post on X, crypto analytics firm Alphractal made an on-chain observation, which shares similar implications with Maartunn’s report. Alphractal’s revelation was based on the Bitcoin: Fear and Greed Index Heatmap metric, which tracks the market sentiment shift — from extreme fear to extreme greed — over time.
The metric ranges with values from 0 to 100. The range 0-24 signals extreme fear in the market; 25-49 reads as fear, while 50 is interpreted as a neutral level, where there’s a balance between both market sentiments. On the other side of the spectrum, ranges 51-74 signal greed in the market; 75-100 signifies extreme greed in the market, showing widespread optimism that often precedes market tops.
According to data from Alphractal, the Fear and Greed Index is at 65, which is still far from the +90 levels observed in November and December 2024. This balance between the buyers and sellers could suggest that the market could be awaiting a catalyst, like macro news or on-chain developments, to get a breakout to either side of the market.
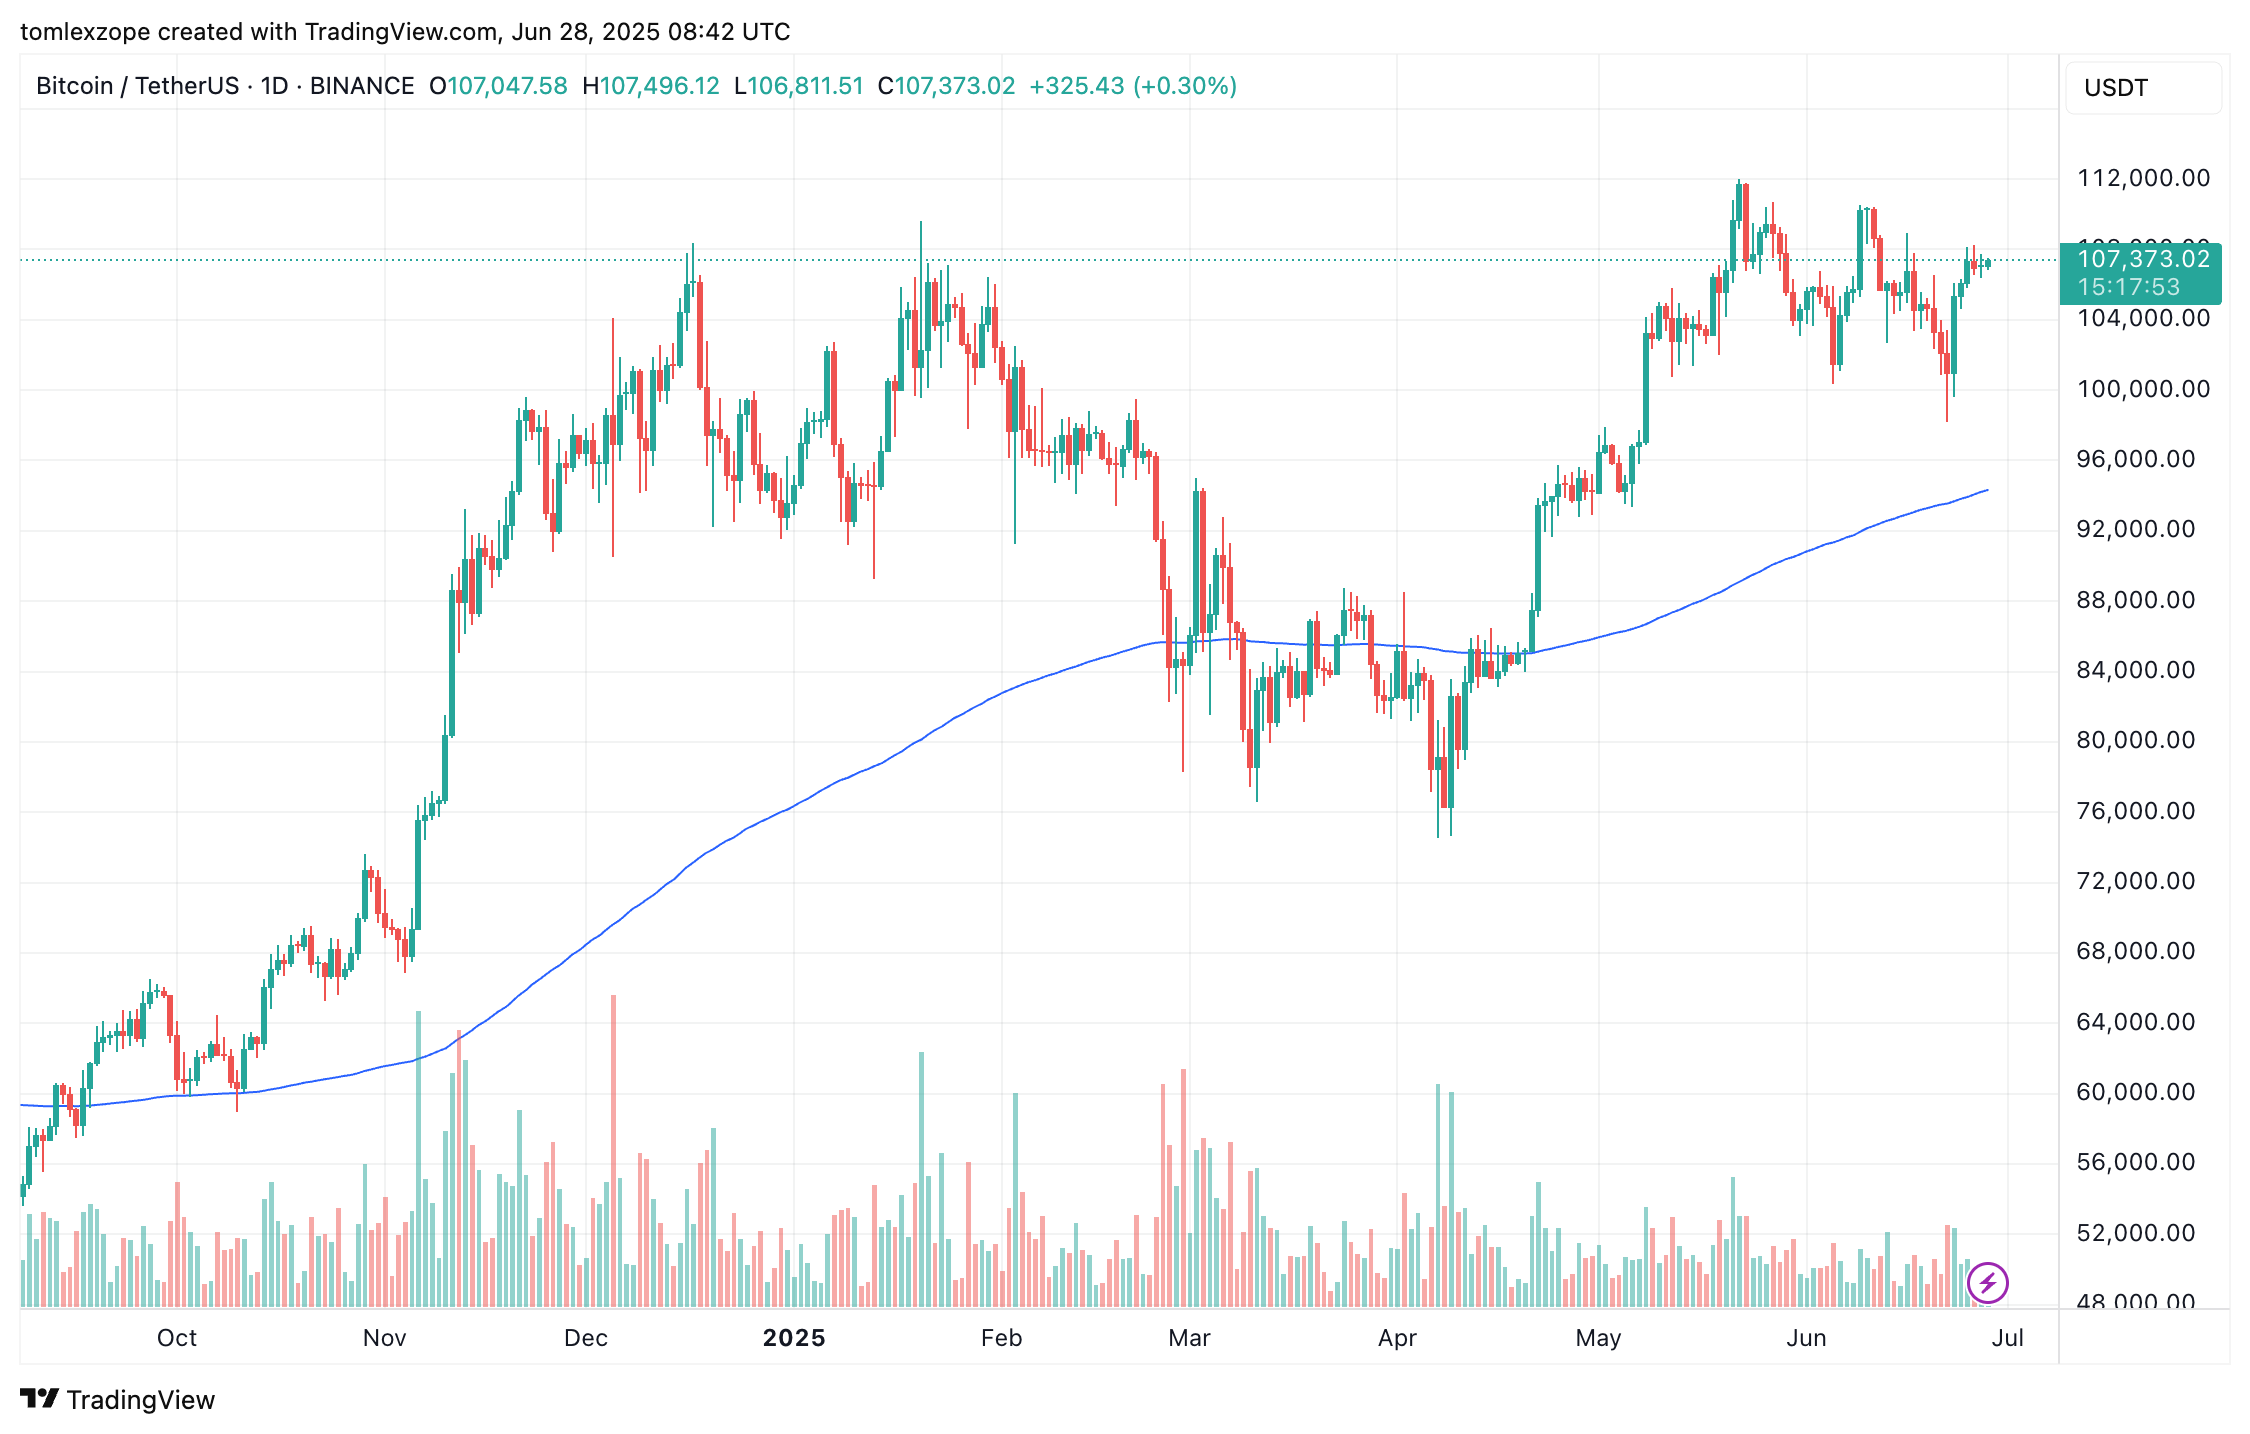
Due to the current uncertainty, traders are advised to tread with caution in the market. As of press time, Bitcoin is valued at about $107,143, with the cryptocurrency losing approximately 0.11% in the past 24 hours.
Featured image from iStock, chart from TradingView

The price of BTC on the daily timeframe | Source: BTCUSDT chart on TradingView
Read the full article here


