


 Price Struggles Below $3,000 as Bearish Pressure Persists")
Ethereum (ETH) price is struggling to reclaim the $3,000 level as bearish momentum continues to weigh on its recovery. The RSI remains neutral, failing to break above 50 since February 1, indicating that buying pressure has yet to strengthen significantly.
Meanwhile, the Directional Movement Index (DMI) shows that ETH is still in a downtrend, though selling pressure has started to ease slightly. With short-term EMAs still below long-term ones, ETH remains at risk of further declines unless momentum shifts in favor of the bulls.
ETH RSI Failed to Break Above 50 Since February 1
Ethereum’s Relative Strength Index (RSI) is currently at 44.7, maintaining a neutral stance since February 3 after briefly plunging to 16.7 on February 2. The RSI is a momentum oscillator that measures the strength and speed of price movements on a scale from 0 to 100.
Typically, an RSI above 70 signals overbought conditions, suggesting a potential price correction, while an RSI below 30 indicates oversold levels, often associated with buying opportunities.
A reading between 30 and 70 is considered neutral, meaning the market lacks a clear bullish or bearish trend.
ETH RSI. Source: TradingView.
With ETH RSI at 44.7, it remains in neutral territory but continues to struggle to break above 50, a level it has failed to reach since February 1. This suggests that while bearish pressure has eased since the extreme oversold conditions of early February, buying momentum remains weak.
If ETH can push its RSI above 50, it would indicate a shift toward bullish control, potentially leading to a stronger price recovery.
However, failure to do so may signal prolonged consolidation or even renewed selling pressure, keeping ETH in a choppy trading range until stronger demand emerges.
Ethereum DMI Shows The Current Trend Is Still Bearish
Ethereum’s Directional Movement Index (DMI) chart shows that its Average Directional Index (ADX) is currently at 34.2, down from 40 just two days ago. The ADX measures trend strength, with values above 25 generally indicating a strong trend and values below 20 suggesting weak or range-bound price action.
A reading of 34.2 confirms that ETH price is still in a well-defined trend, though the slight decline in ADX suggests that trend strength is weakening.
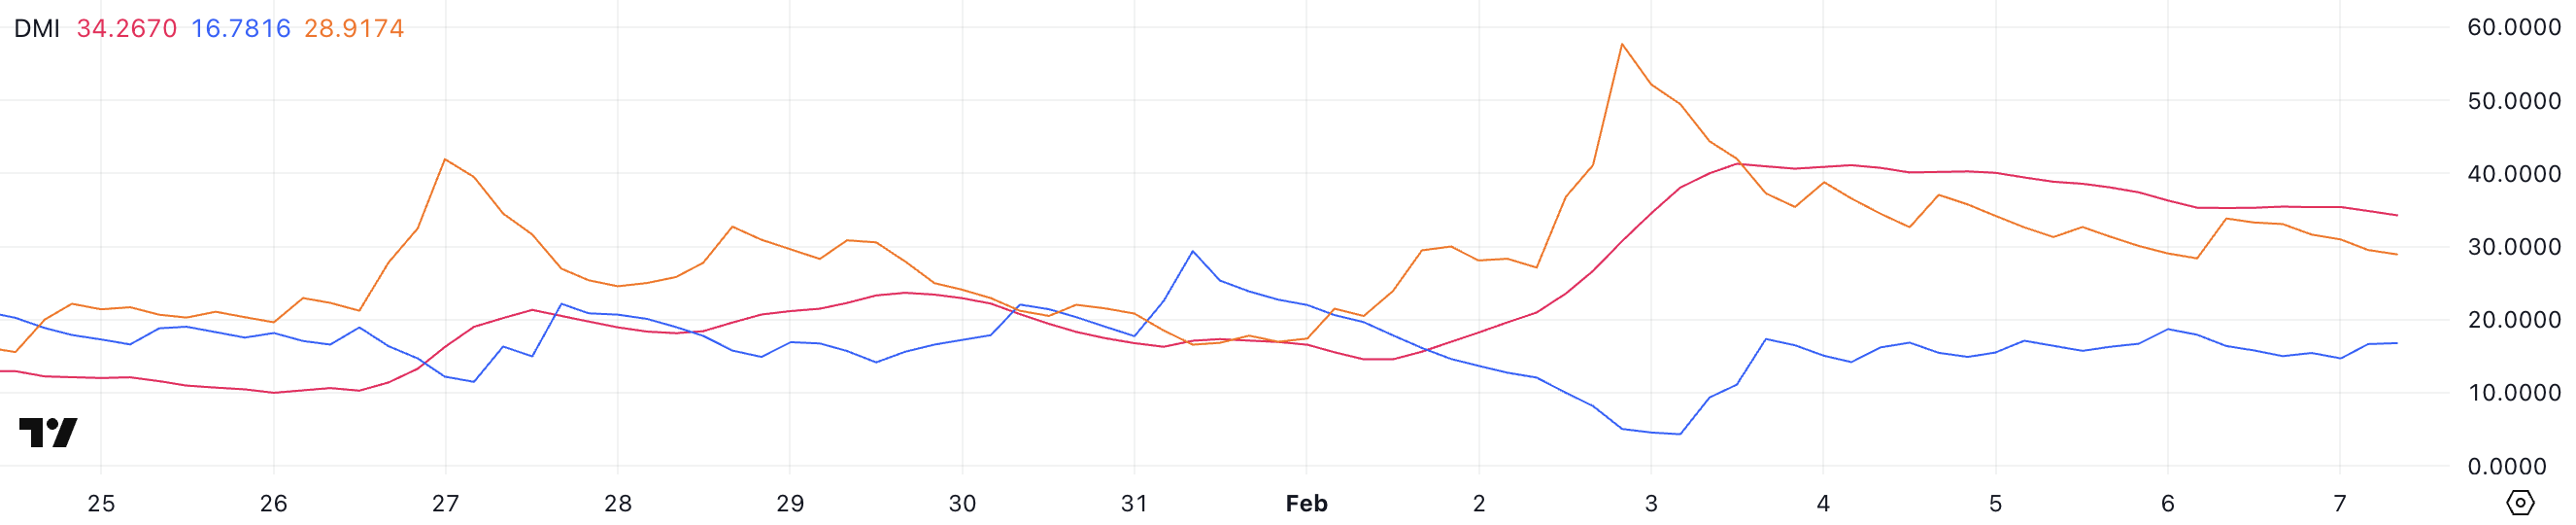
ETH DMI. Source: TradingView.
ETH’s +DI is currently at 16.7 and has been fluctuating between 14 and 18 over the past four days. That indicates a weak bullish momentum. Meanwhile, the -DI has dropped from 33.8 yesterday to 28.9, suggesting that selling pressure could be easing.
Despite this, Ethereum remains in a downtrend, as the -DI is still significantly higher than the +DI. If the +DI begins to rise while the -DI continues to decline, it could suggest an early shift in momentum toward a potential trend reversal.
However, as long as the -DI remains dominant and ADX holds above 25, ETH could continue facing downside risks before any significant recovery materializes.
ETH Price Prediction: Will Ethereum Return To $3,000 In The Next Days?
Ethereum Exponential Moving Average (EMA) lines continue to indicate a bearish trend, with short-term EMAs still positioned below long-term ones. This alignment suggests that downward pressure remains dominant, keeping ETH at risk of further declines.
If this bearish momentum persists, Ethereum price could test the support level at $2,356, and a failure to hold this zone could lead to a deeper drop toward $2,163.
The current EMA structure reflects a market where sellers remain in control, and a clear shift in trend would be required to reverse the ongoing decline.
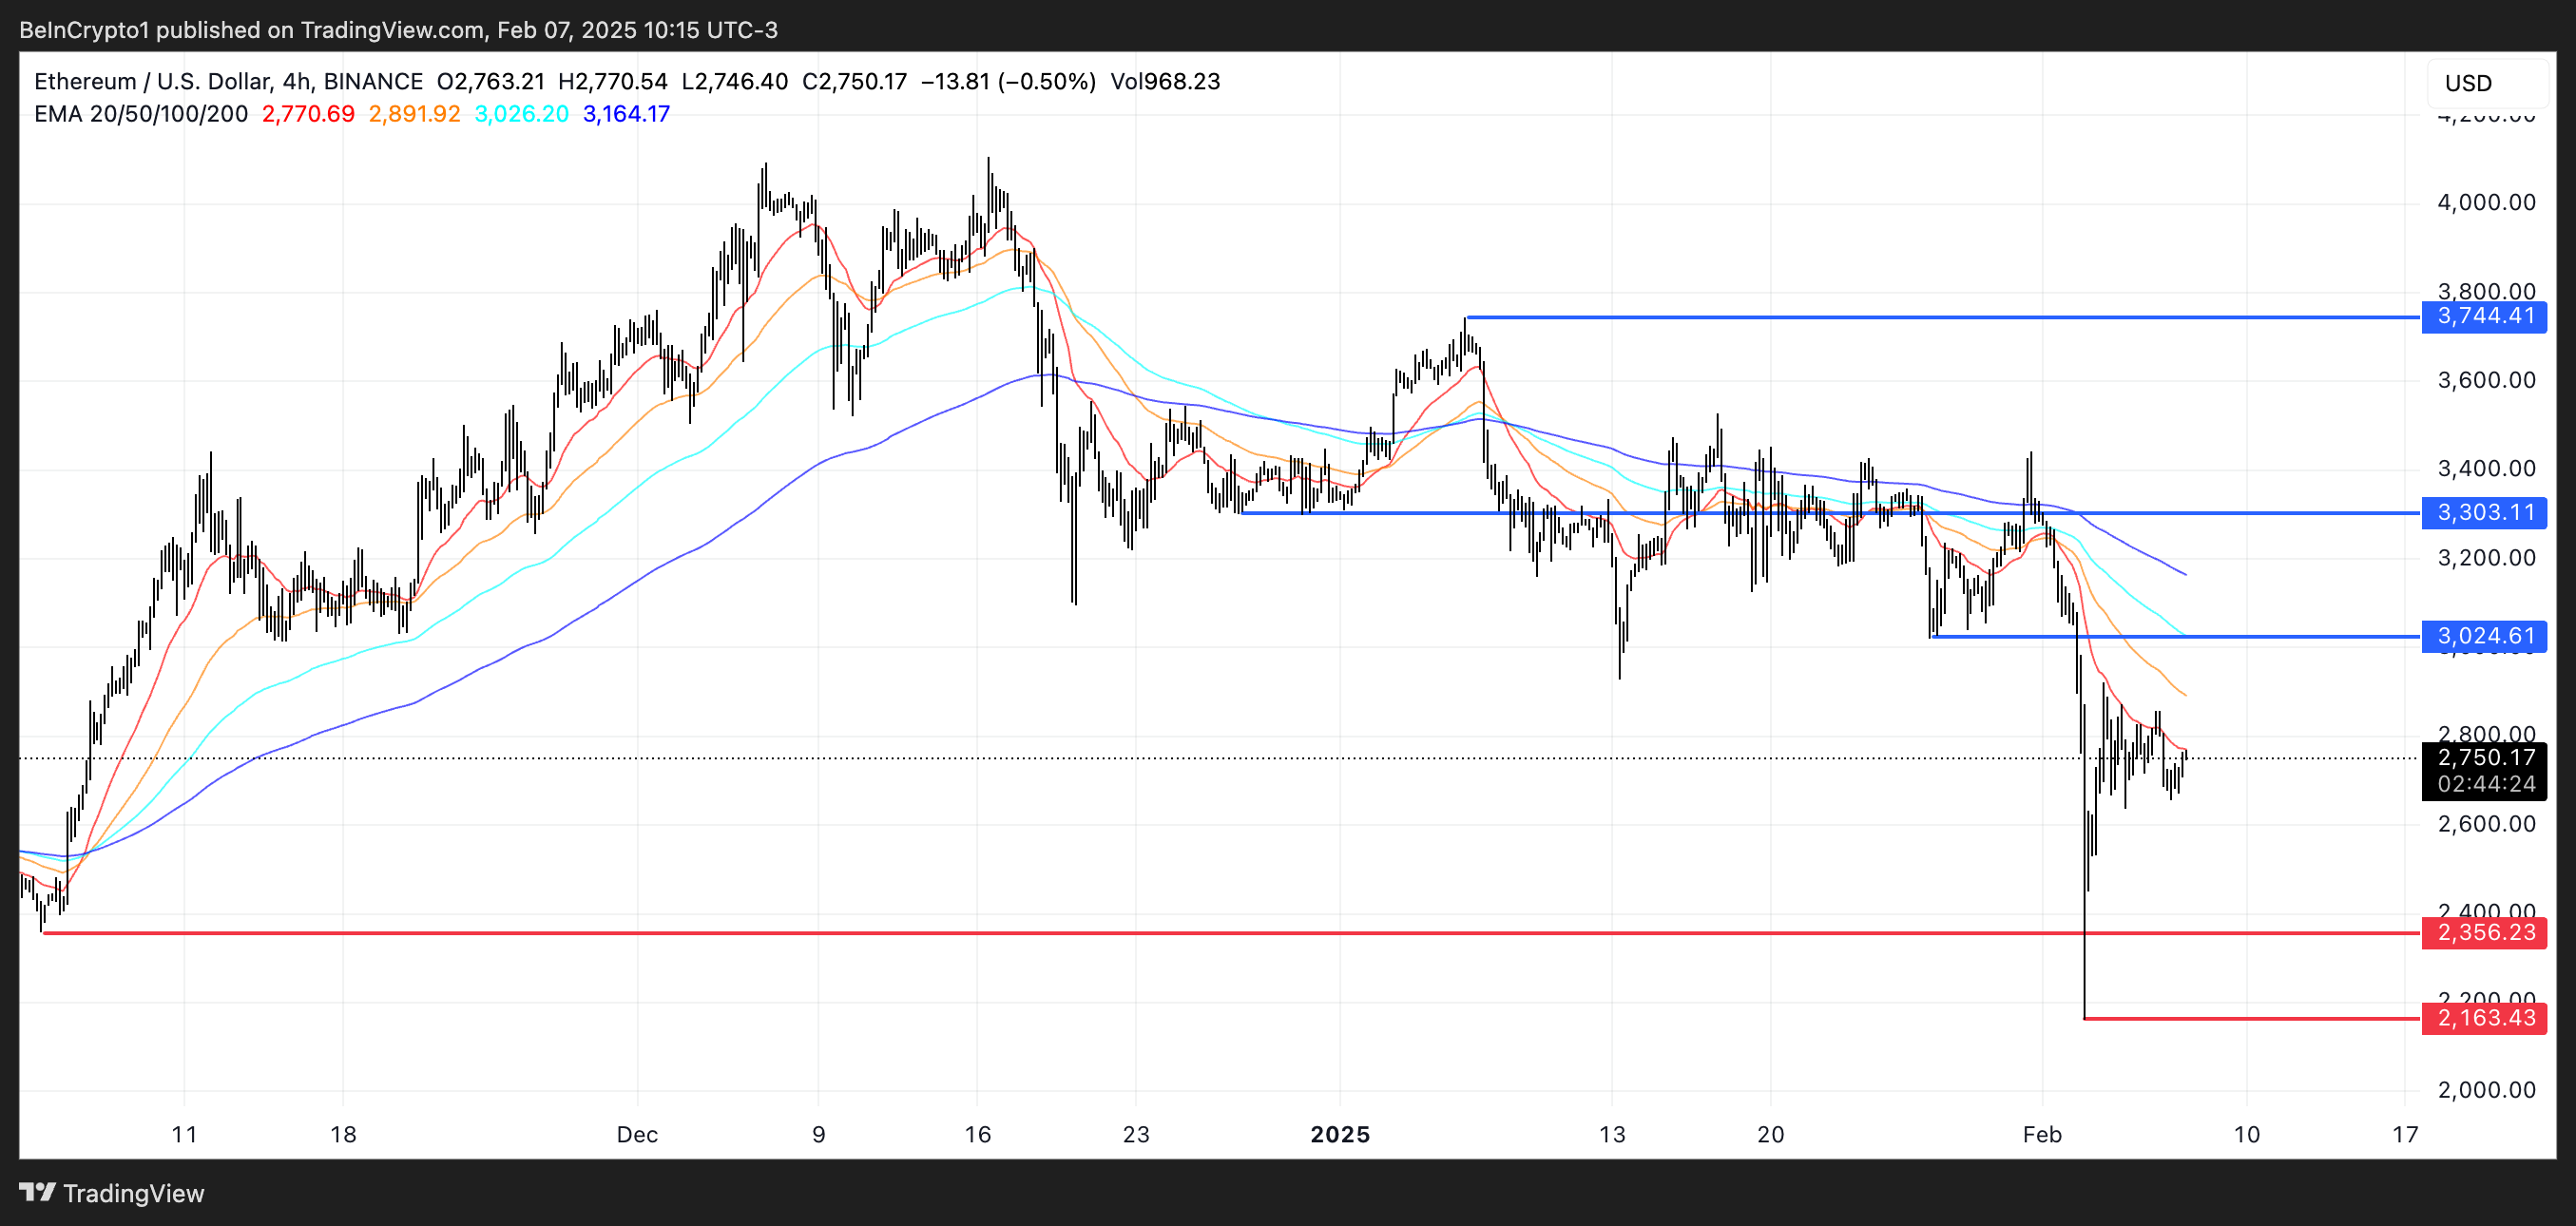
ETH Price Analysis. Source: TradingView.
However, if ETH can regain positive momentum, it could make a move back toward the $3,000 level. A breakout above this psychological resistance could signal renewed bullish strength, potentially pushing ETH to $3,300.
If buying pressure remains strong beyond this point, ETH price could even rally to $3,744, marking its highest price since January 6.
Read the full article here


