Close Menu
Crypto Chain Post
    Trending

    US PCE Inflation Comes in Hot at 2.3%, What’s Next for Bitcoin Price?

    June 28, 2025

    NFT sales reach $125m, Ethereum dethrones Polygon

    June 28, 2025

    Aptos hits milestone as RWA on-chain breaks $540m

    June 28, 2025

    Binance Never Delisted XRP During Ripple Lawsuit, CZ Comments

    June 28, 2025

    Bitcoin Bull Trend Remains Intact, According to Crypto Analytics Firm Glassnode – But There’s a Catch

    June 28, 2025
    Facebook X (Twitter) Instagram TikTok Telegram
    • Privacy Policy
    • Terms of use
    • Advertise
    • Contact
    Saturday, June 28
    Crypto Chain Post
    Price Index Newsletter
    • Home
    • News
      • Bitcoin
      • Ethereum
      • Altcoin
    • Blockchain
    • Markets
    • NFTs
    • DeFi
    • Web3
    • Analysis
    • Metaverse
    • Resources
      • Price Index
      • Crypto Heatmap
      • Glossary
      • Exchange
      • Economic Calendar
    • More
      • GameFi
      • ICO
      • Legal
      • Security
    Crypto Chain Post
    Home » Ethereum Stays In Its Range And Falls From A High Of $2,800
    Ethereum

    Ethereum Stays In Its Range And Falls From A High Of $2,800

    News RoomBy News RoomOctober 22, 2024No Comments2 Mins Read

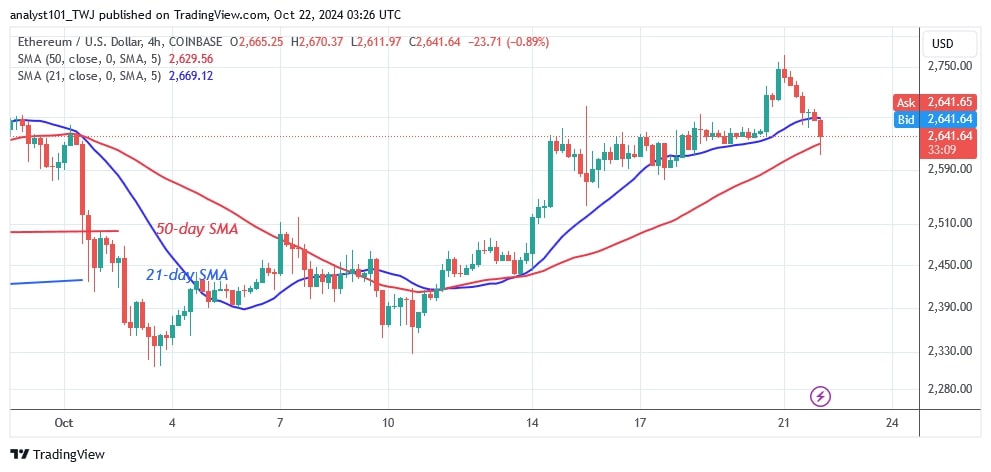
    Ethereum (ETH) rose to a high of $2,758 before being pushed back. This is the fifth time Ether has tested the $2,800 resistance level.

    Ethereum price long-term analysis: bullish

    The largest altcoin has settled between $2,200 and $2,800. Today, Ether is dropping towards the moving average lines. The uptrend will continue if it retraces and stays above the moving average lines.

    However, the urge to sell Ether will continue if the bear breaks below these lines. The altcoin will crash and regain its previous low above $2,300. At the time of writing, the altcoin is valued at $2,645.

    Analysis of the Ethereum indicators

    The moving average lines are horizontal due to the price movement between $2,200 and $2,800. On the 4-hour chart, the price of the cryptocurrency lies between the moving average lines, indicating that it will continue to move in a range. Doji candlesticks also influence the price movement.

    Technical Indicators:

    Resistance Levels – $4,000 and $4,500

    Support Levels – $3.500 and $3,000

    What is the next direction for Ethereum?

    The 4-hour chart shows that Ether is in an upward correction and has reached a high of $2,768. Buyers tried to break through the resistance at $2,800 but failed to do so. The upward movement of the price was slowed down by the resistance at $2,800. Today, the largest altcoin has returned to its trading range after rejecting the recent high.
    Disclaimer. This analysis and forecast are the personal opinions of the author. They are not a recommendation to buy or sell cryptocurrency and should not be viewed as an endorsement by CoinIdol.com. Readers should do their research before investing in funds.

    Read the full article here

    Share. Facebook Twitter Pinterest LinkedIn Tumblr Email

    Related News

    SharpLink Gaming Makes Bold $4.82M Ethereum Investment, Reinforcing Massive Digital Asset Strategy

    June 28, 2025

    Unveiling the Crucial Impact of a $39.8M Coinbase Prime Transfer

    June 28, 2025

    Will Ethereum Coin Hold the $2,400 Support?

    June 28, 2025

    Ethereum (ETH) Price Prediction for June 28

    June 28, 2025
    Add A Comment
    Leave A Reply Cancel Reply

    Top News

    NFT sales reach $125m, Ethereum dethrones Polygon

    June 28, 2025

    Aptos hits milestone as RWA on-chain breaks $540m

    June 28, 2025

    Binance Never Delisted XRP During Ripple Lawsuit, CZ Comments

    June 28, 2025
    Advertisement
    Demo
    Crypto Chain Post
    • Home
    • Privacy Policy
    • Terms of use
    • Advertise
    • Contact
    © 2025 Crypto Chain Post. All Rights Reserved.

    71-75 Shelton Street, Covent Garden, London United Kingdom, WC2H 9JQ

    Type above and press Enter to search. Press Esc to cancel.