Close Menu
Crypto Chain Post
    Trending

    Is Crypto Pricing Being Artificially Suppressed by Centralized Platforms?

    June 25, 2025

    Major BNB Chain Product Exploit: Scam Alert

    June 25, 2025

    $915 Million Purchase May Ignite Traction

    June 25, 2025

    Change In US Crypto Laws May Affect Charges In Do Kwon’s Criminal Case

    June 25, 2025

    Grayscale Launches Space and Time Trust Focused on SXT Token

    June 25, 2025
    Facebook X (Twitter) Instagram TikTok Telegram
    • Privacy Policy
    • Terms of use
    • Advertise
    • Contact
    Wednesday, June 25
    Crypto Chain Post
    Price Index Newsletter
    • Home
    • News
      • Bitcoin
      • Ethereum
      • Altcoin
    • Blockchain
    • Markets
    • NFTs
    • DeFi
    • Web3
    • Analysis
    • Metaverse
    • Resources
      • Price Index
      • Crypto Heatmap
      • Glossary
      • Exchange
      • Economic Calendar
    • More
      • GameFi
      • ICO
      • Legal
      • Security
    Crypto Chain Post
    Home » Ethereum’s Uptrend Slows Down When It Reaches The $3,400 Mark
    Ethereum

    Ethereum’s Uptrend Slows Down When It Reaches The $3,400 Mark

    News RoomBy News RoomNovember 25, 2024No Comments2 Mins Read

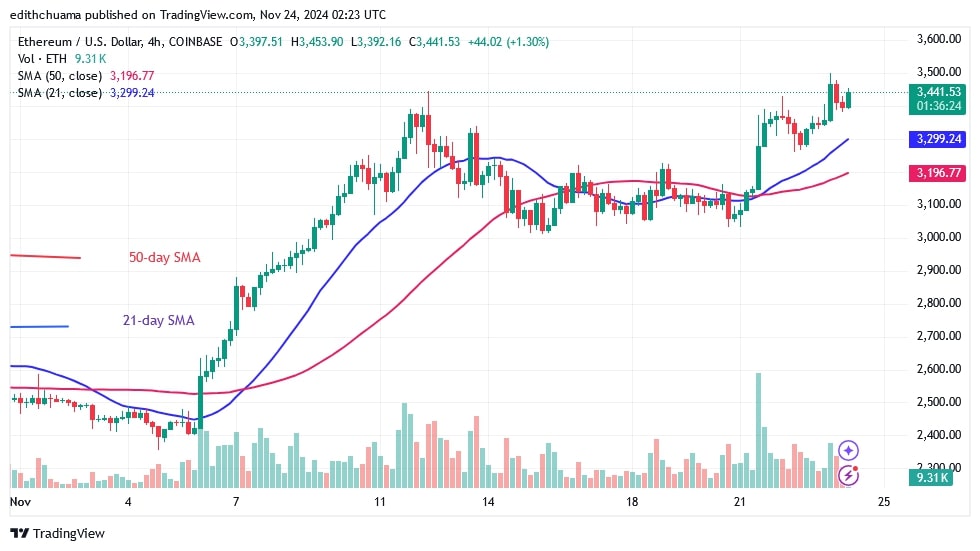
    Ethereum (ETH) price has continued its uptrend and bounced above the moving average lines. The bears have already pushed the altcoin to the $3,000 support level twice before it recovered.

    Ethereum price long-term analysis: bullish

    On the upside, the price of the cryptocurrency is testing the $3,400 mark for the third time, trying to break above the resistance. Ether has already faced resistance twice when it fell above the $3,000 low or the 21-day SMA support. If buyers maintain the bullish momentum above $3,400, Ether will rally to $3,800. The uptrend will continue to the high of $4,000. If Ether retraces from its recent high, it will return above the 21-day SMA. It is currently trading at $3,423.

    Analysis of the Ethereum indicators

    The price bars are above the 21-day SMA, which supports the uptrend. On the daily chart, two candlestick wicks indicate the resistance level. This shows that there is significant selling pressure at the recent high. The price action has been limited by the doji candlesticks.

    Technical Indicators:

    Resistance Levels – $4,000 and $4,500

    Support Levels – $3.500 and $3,000

    What is the next direction for Ethereum?

    Ether is trading sideways on the 4-hour chart after rejecting the high of $3,400. On November 23, the largest altcoin was pushed back again, causing it to resume its sideways movement. On the upside, the doji candlesticks cast doubt on a further rise in the cryptocurrency.
    Disclaimer. This analysis and forecast are the personal opinions of the author. They are not a recommendation to buy or sell cryptocurrency and should not be viewed as an endorsement by CoinIdol.com. Readers should do their research before investing in funds.

    Read the full article here

    Share. Facebook Twitter Pinterest LinkedIn Tumblr Email

    Related News

    Vitalik Buterin Confirms Ethereum Foundation Support for Tornado Cash Cofounder

    June 25, 2025

    Ethereum (ETH) Price Prediction For June 26

    June 25, 2025

    Ethereum price Eyes 107% Surge as Golden Cross Pattern Returns

    June 25, 2025

    BlackRock Resumes Ethereum Acquisition After Single Sell-Off

    June 25, 2025
    Add A Comment
    Leave A Reply Cancel Reply

    Top News

    Major BNB Chain Product Exploit: Scam Alert

    June 25, 2025

    $915 Million Purchase May Ignite Traction

    June 25, 2025

    Change In US Crypto Laws May Affect Charges In Do Kwon’s Criminal Case

    June 25, 2025
    Advertisement
    Demo
    Crypto Chain Post
    • Home
    • Privacy Policy
    • Terms of use
    • Advertise
    • Contact
    © 2025 Crypto Chain Post. All Rights Reserved.

    71-75 Shelton Street, Covent Garden, London United Kingdom, WC2H 9JQ

    Type above and press Enter to search. Press Esc to cancel.