


Bitcoin Price Prediction: BTC Breaks Above $109K but Faces Critical Test
Bitcoin price is back in the spotlight this Tuesday, having pushed through the long-standing resistance level at $109,000. Currently trading around $109,252, the move comes after a sharp rally from the $100K zone earlier this month. While bulls are celebrating the breakout, market watchers remain cautious—especially with signs that this could mimic the previous false breakout above $109K.
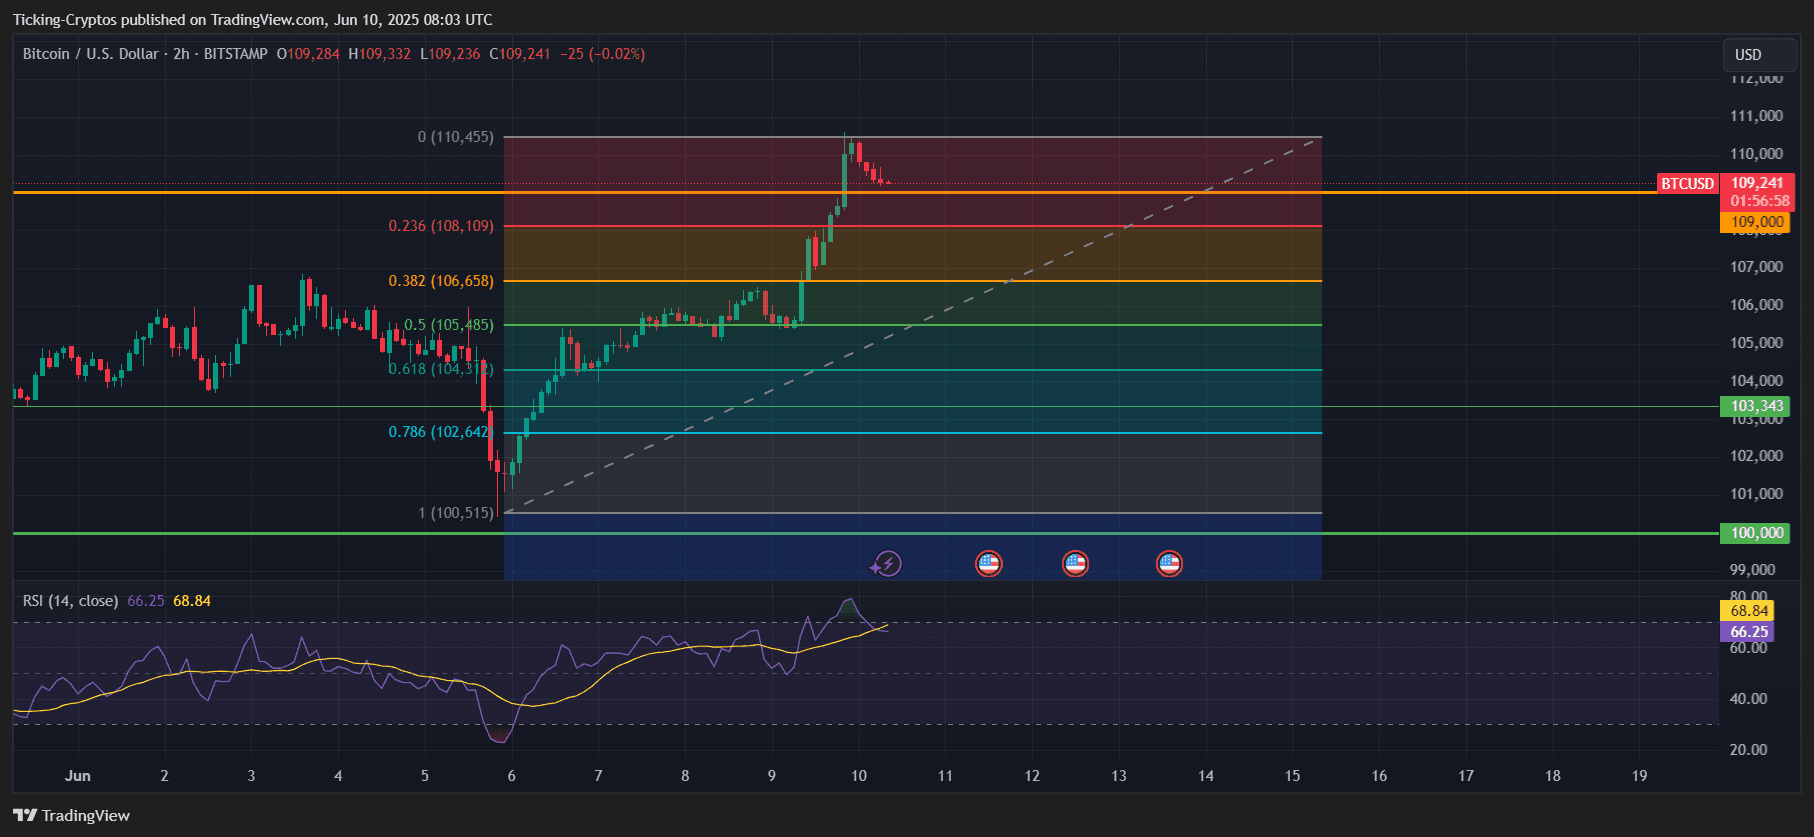
BTC/USD 2-hours chart – TradingView
The key question now is whether BTC can hold above this level or if it will follow the same pattern as before—failing to sustain above resistance and pulling back toward the 38.2% Fibonacci retracement around $106,700.
Bitcoin News: Support Holding or Setup for a Classic Fakeout?
- Historical Pattern: A similar breakout above $109K in late May quickly reversed and dropped nearly 10%. That pattern is fresh in the minds of short-term traders.
- Current Structure: The 2-hour chart shows BTC pulling back slightly after peaking at $109,678. The RSI is hovering near 67, signaling possible short-term exhaustion.
- Support and Risk Zone: If this is another fakeout, BTC could revisit the 38.2% Fibonacci level near $106,700, which aligns with the 50-period SMA now sitting at $106,032. This area becomes critical support for the short-term trend.
BTC/USD 2-hours chart – TradingView
Scenarios to Watch: Bullish or Bearish Rejection?
Bullish Continuation: If $109K flips into solid support, this breakout could fuel a larger rally toward the next target at $115,000, especially if macro news or ETF flows remain supportive.
Bearish Reversal: A failure to hold $109K, combined with RSI divergence or declining momentum, could trigger a retracement toward $106.7K, or even $103.3K in a deeper pullback.
Bitcoin Price Prediction for the Week
📈 Bullish Scenario: Retest and hold above $109,000 confirms breakout strength → next target: $115,000
📉 Bearish Scenario: Failure to hold $109K → likely retracement to $106,700 (Fib 38.2%) or even $103,343
The current breakout is promising, but traders should watch closely for confirmation or invalidation. Price action over the next 24–48 hours will reveal whether $109K is the new launchpad—or just another bull trap.
Read the full article here


 Warning from Bloomberg Analyst Mike McGlone! “At a Risky Turning Point!”")