Close Menu
Crypto Chain Post
    Trending

    Coinbase (COIN) Stock Hits 52-Week High, Nears All-Time Record Amid Crypto Rally

    June 25, 2025

    BTCC Exchange Celebrates 14th Anniversary With Launch of First-Ever User Badge Program

    June 25, 2025

    Price Holds Above $105K as Technical Reversal Builds

    June 25, 2025

    CME Group’s XRP Futures Hit $542 Million in Monthly Volume

    June 25, 2025

    Here’s the Current Status of the Altcoin Season Index – Analyst Takes an In-Depth Look at Potential Altcoin Bull Run

    June 25, 2025
    Facebook X (Twitter) Instagram TikTok Telegram
    • Privacy Policy
    • Terms of use
    • Advertise
    • Contact
    Wednesday, June 25
    Crypto Chain Post
    Price Index Newsletter
    • Home
    • News
      • Bitcoin
      • Ethereum
      • Altcoin
    • Blockchain
    • Markets
    • NFTs
    • DeFi
    • Web3
    • Analysis
    • Metaverse
    • Resources
      • Price Index
      • Crypto Heatmap
      • Glossary
      • Exchange
      • Economic Calendar
    • More
      • GameFi
      • ICO
      • Legal
      • Security
    Crypto Chain Post
    Home » This Is Why Ethereum (ETH) Risks Falling Below $3,000
    Ethereum

    This Is Why Ethereum (ETH) Risks Falling Below $3,000

    News RoomBy News RoomNovember 24, 2024No Comments2 Mins Read

    Ethereum (ETH) is currently facing significant downward pressure, with its price declining by 3% over the past 24 hours. This bearish trend could push ETH’s price below the critical $3,000 price level.

    This analysis examines the factors contributing to this likelihood.

    Ethereum Sellers Re-Emerge

    An assessment of the ETH/USD one-day chart has revealed that the coin’s moving average convergence divergence (MACD) indicator is forming a potential death cross. As of this writing, the coin’s MACD line (blue) is attempting to fall below its signal line (orange).

    This indicator measures an asset’s price trends and momentum and identifies its potential buy or sell signals. A MACD death cross occurs when the MACD line (the shorter-term moving average) crosses below the signal line (the longer-term moving average), indicating a bearish trend or momentum reversal. This signal suggests that selling pressure is increasing, and the asset’s price could decline further.

    ETH MACD. Source: TradingView

    ETH’s rising Aroon Down Line confirms this strengthening bearish pressure. It currently sits at 78.57%, confirming that the decline in ETH’s price is gaining momentum.

    The Aroon Indicator evaluates the strength of an asset’s price trend through two components: the Aroon Up line, which reflects the strength of an uptrend, and the Aroon Down line, which reflects the strength of a downtrend. A rising Aroon Down line indicates that recent lows are occurring more frequently, signaling growing bearish momentum or the start of a downtrend.

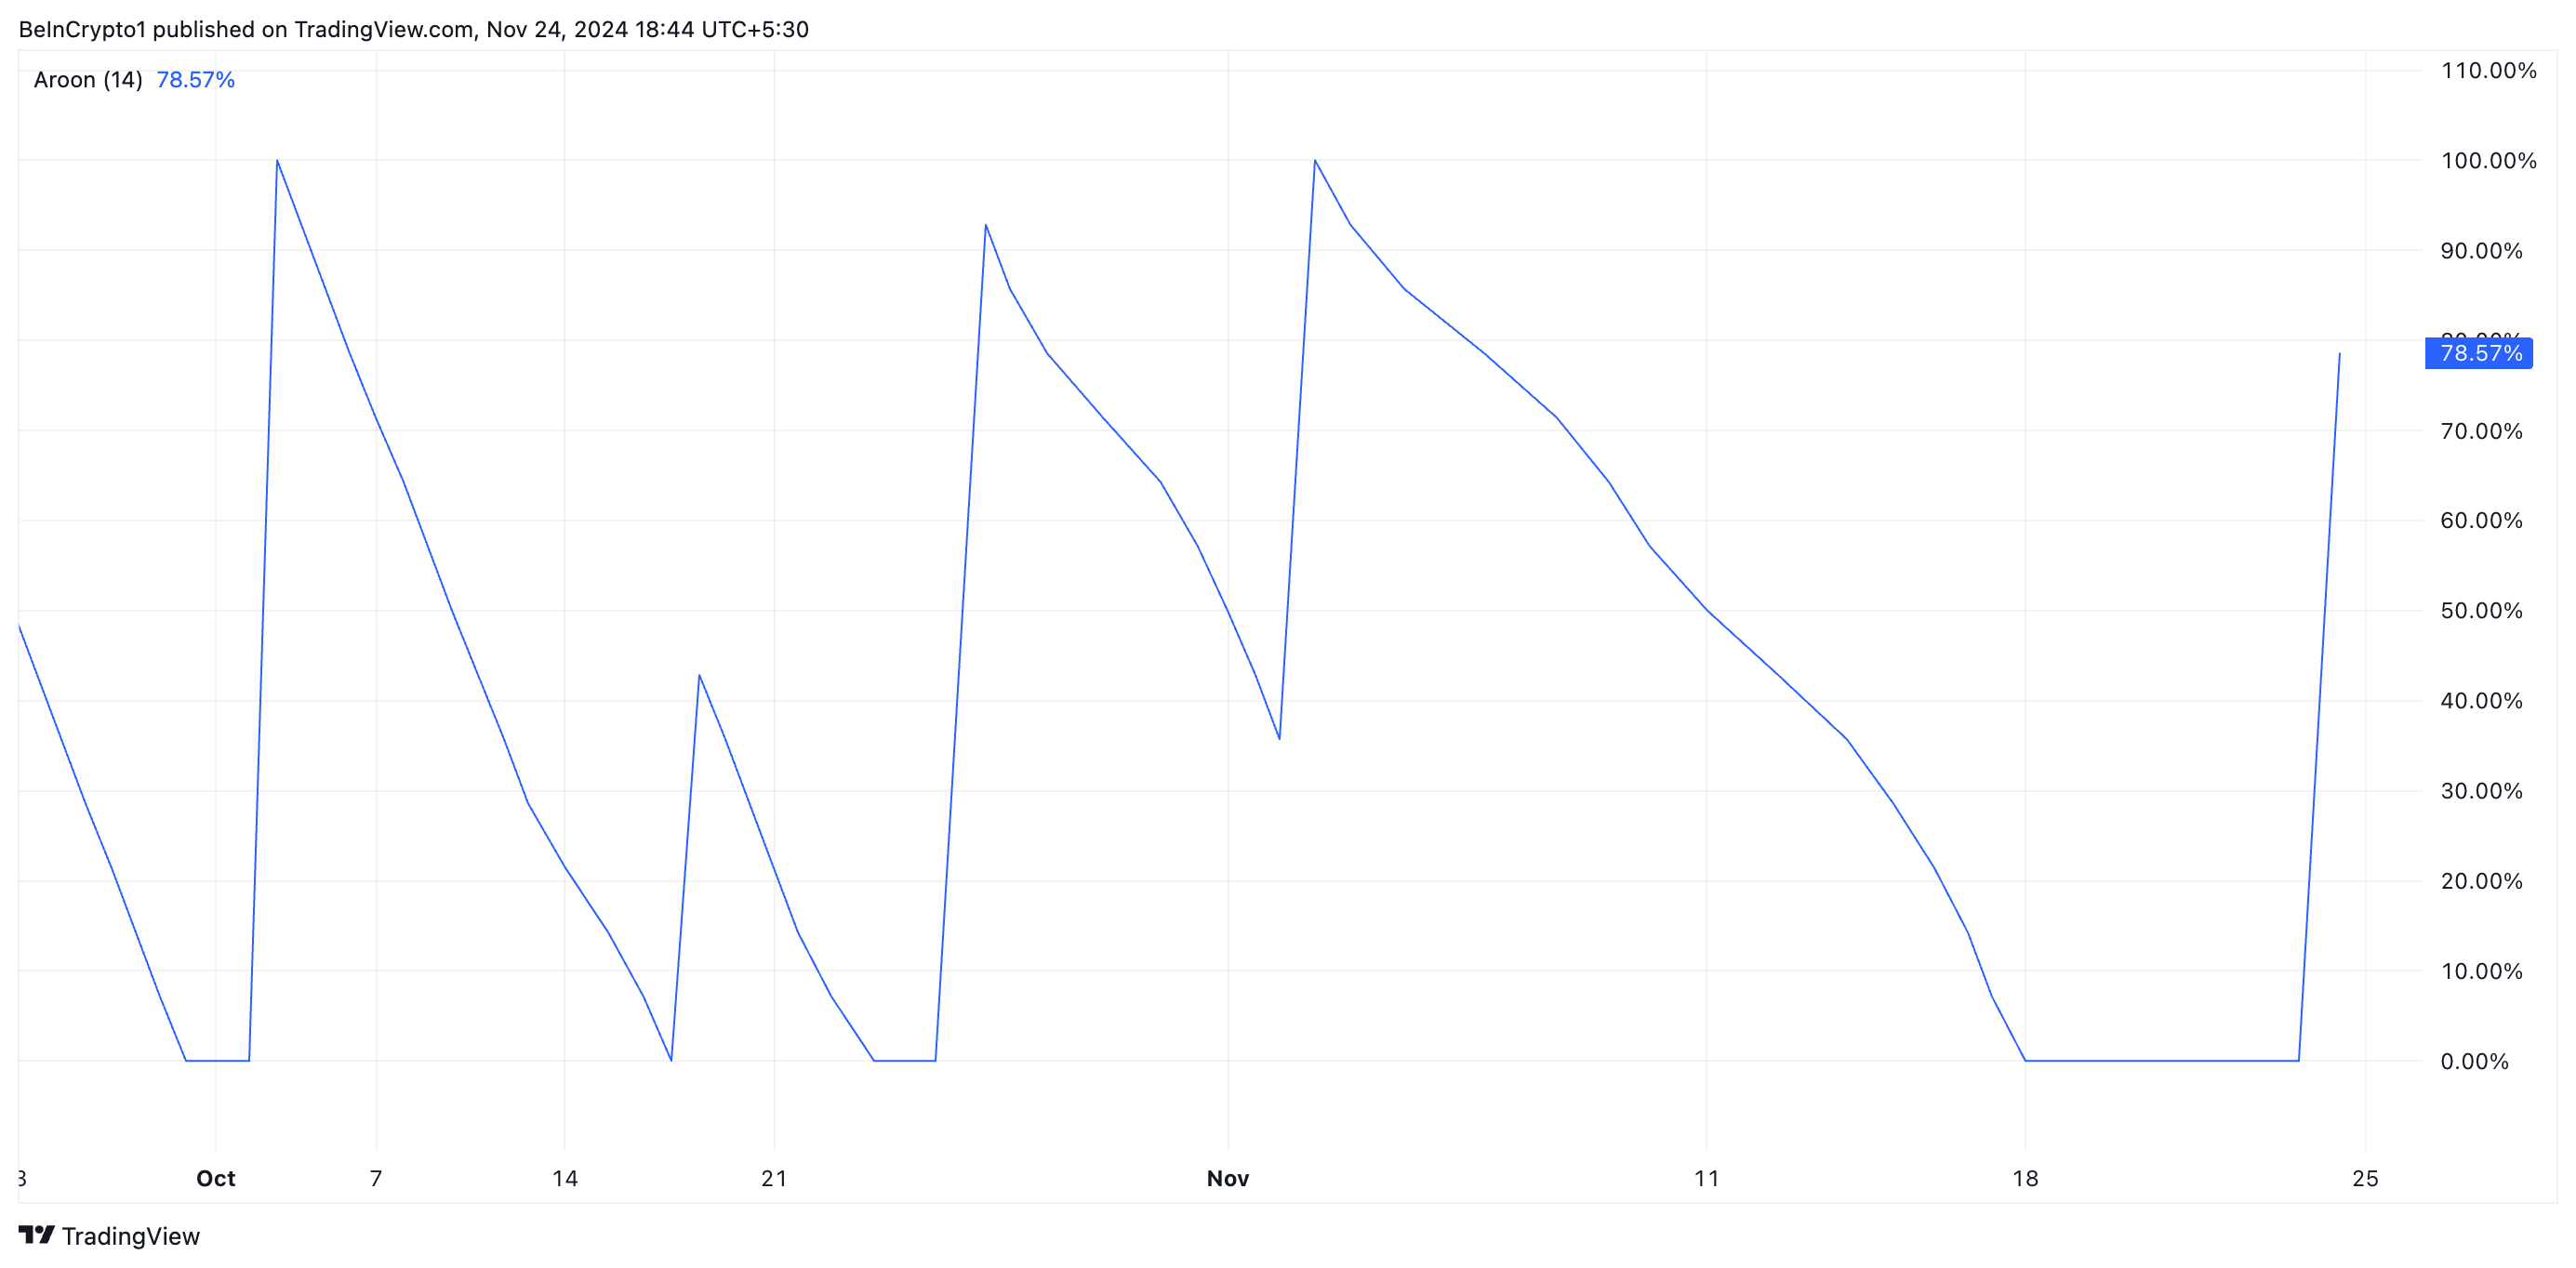
    ETH Aroon Down Line. Source: TradingView

    ETH Price Prediction: Key Support Level To Watch

    ETH currently trades at $3,333, resting above the support formed at $3,203. This level is crucial because a decline below it will cause ETH to exchange hands under $3000. According to readings from the coin’s Fibonacci Retracement tool, the Ethereum price will drop to $2,970 if this happens.

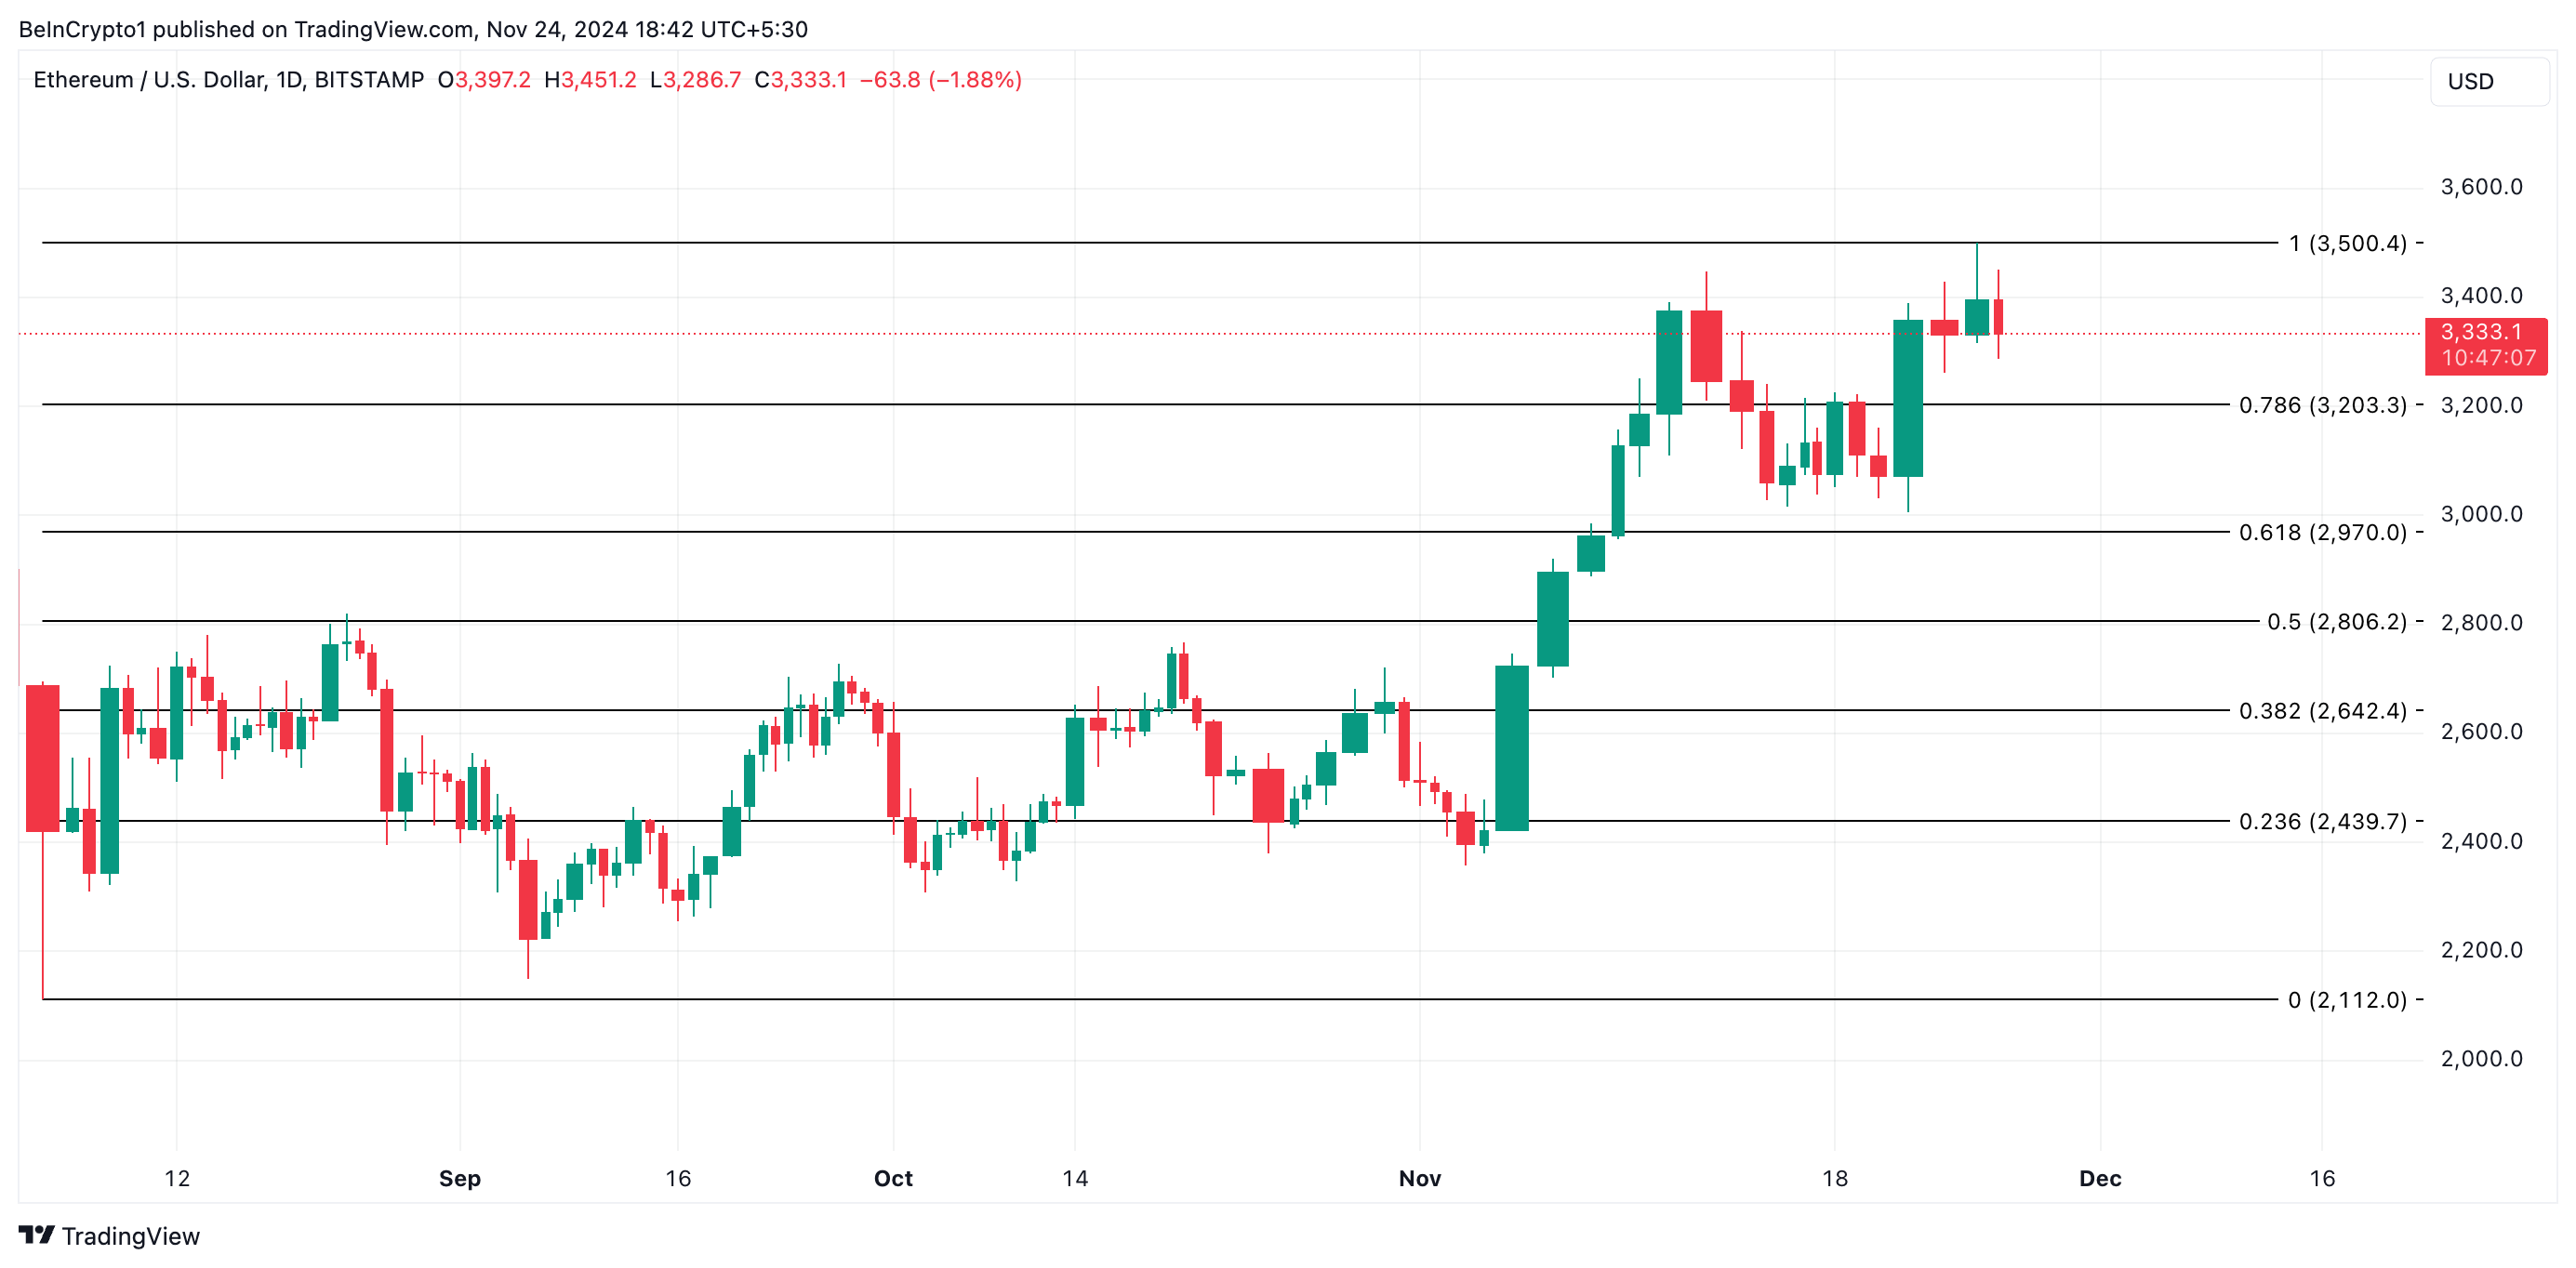
    ETH Price Analysis. Source: TradingView

    However, a resurgence in the demand for the leading altcoin will invalidate this bearish thesis. If this occurs, Ethereum will rally toward $3,500.

    Read the full article here

    Share. Facebook Twitter Pinterest LinkedIn Tumblr Email

    Related News

    Vitalik Buterin Confirms Ethereum Foundation Support for Tornado Cash Cofounder

    June 25, 2025

    Ethereum (ETH) Price Prediction For June 26

    June 25, 2025

    Ethereum price Eyes 107% Surge as Golden Cross Pattern Returns

    June 25, 2025

    BlackRock Resumes Ethereum Acquisition After Single Sell-Off

    June 25, 2025
    Add A Comment
    Leave A Reply Cancel Reply

    Top News

    BTCC Exchange Celebrates 14th Anniversary With Launch of First-Ever User Badge Program

    June 25, 2025

    Price Holds Above $105K as Technical Reversal Builds

    June 25, 2025

    CME Group’s XRP Futures Hit $542 Million in Monthly Volume

    June 25, 2025
    Advertisement
    Demo
    Crypto Chain Post
    • Home
    • Privacy Policy
    • Terms of use
    • Advertise
    • Contact
    © 2025 Crypto Chain Post. All Rights Reserved.

    71-75 Shelton Street, Covent Garden, London United Kingdom, WC2H 9JQ

    Type above and press Enter to search. Press Esc to cancel.