


XRP price has been under pressure this year, dropping by over 37% from its highest point in November.
Ripple (XRP) was trading at $2.15 on Friday, a notable price as it matches the level seen on January 1. The coin has formed a distinct bearish pattern, signaling a potential 75% crash to $0.52.
On-chain metrics suggest that the network is struggling. Active addresses have plunged from 612,000 in March to just 16,000 today. Similarly, there are signs of whale capitulation. Addresses holding between 10 million and 100 million coins now hold 7.53 billion XRP, down from 7.8 billion last week.
XRP on-chain data | Source: Santiment
Additionally, the recently launched Teucrium 2x Long Daily XRP ETF appears to be losing momentum. Its assets under management have declined from $110 million in May to $102 million.
You might also like: Trump vs. Musk sparks memecoin frenzy as KBBB rallies to $53m market cap
XRP price technical analysis points to a crash
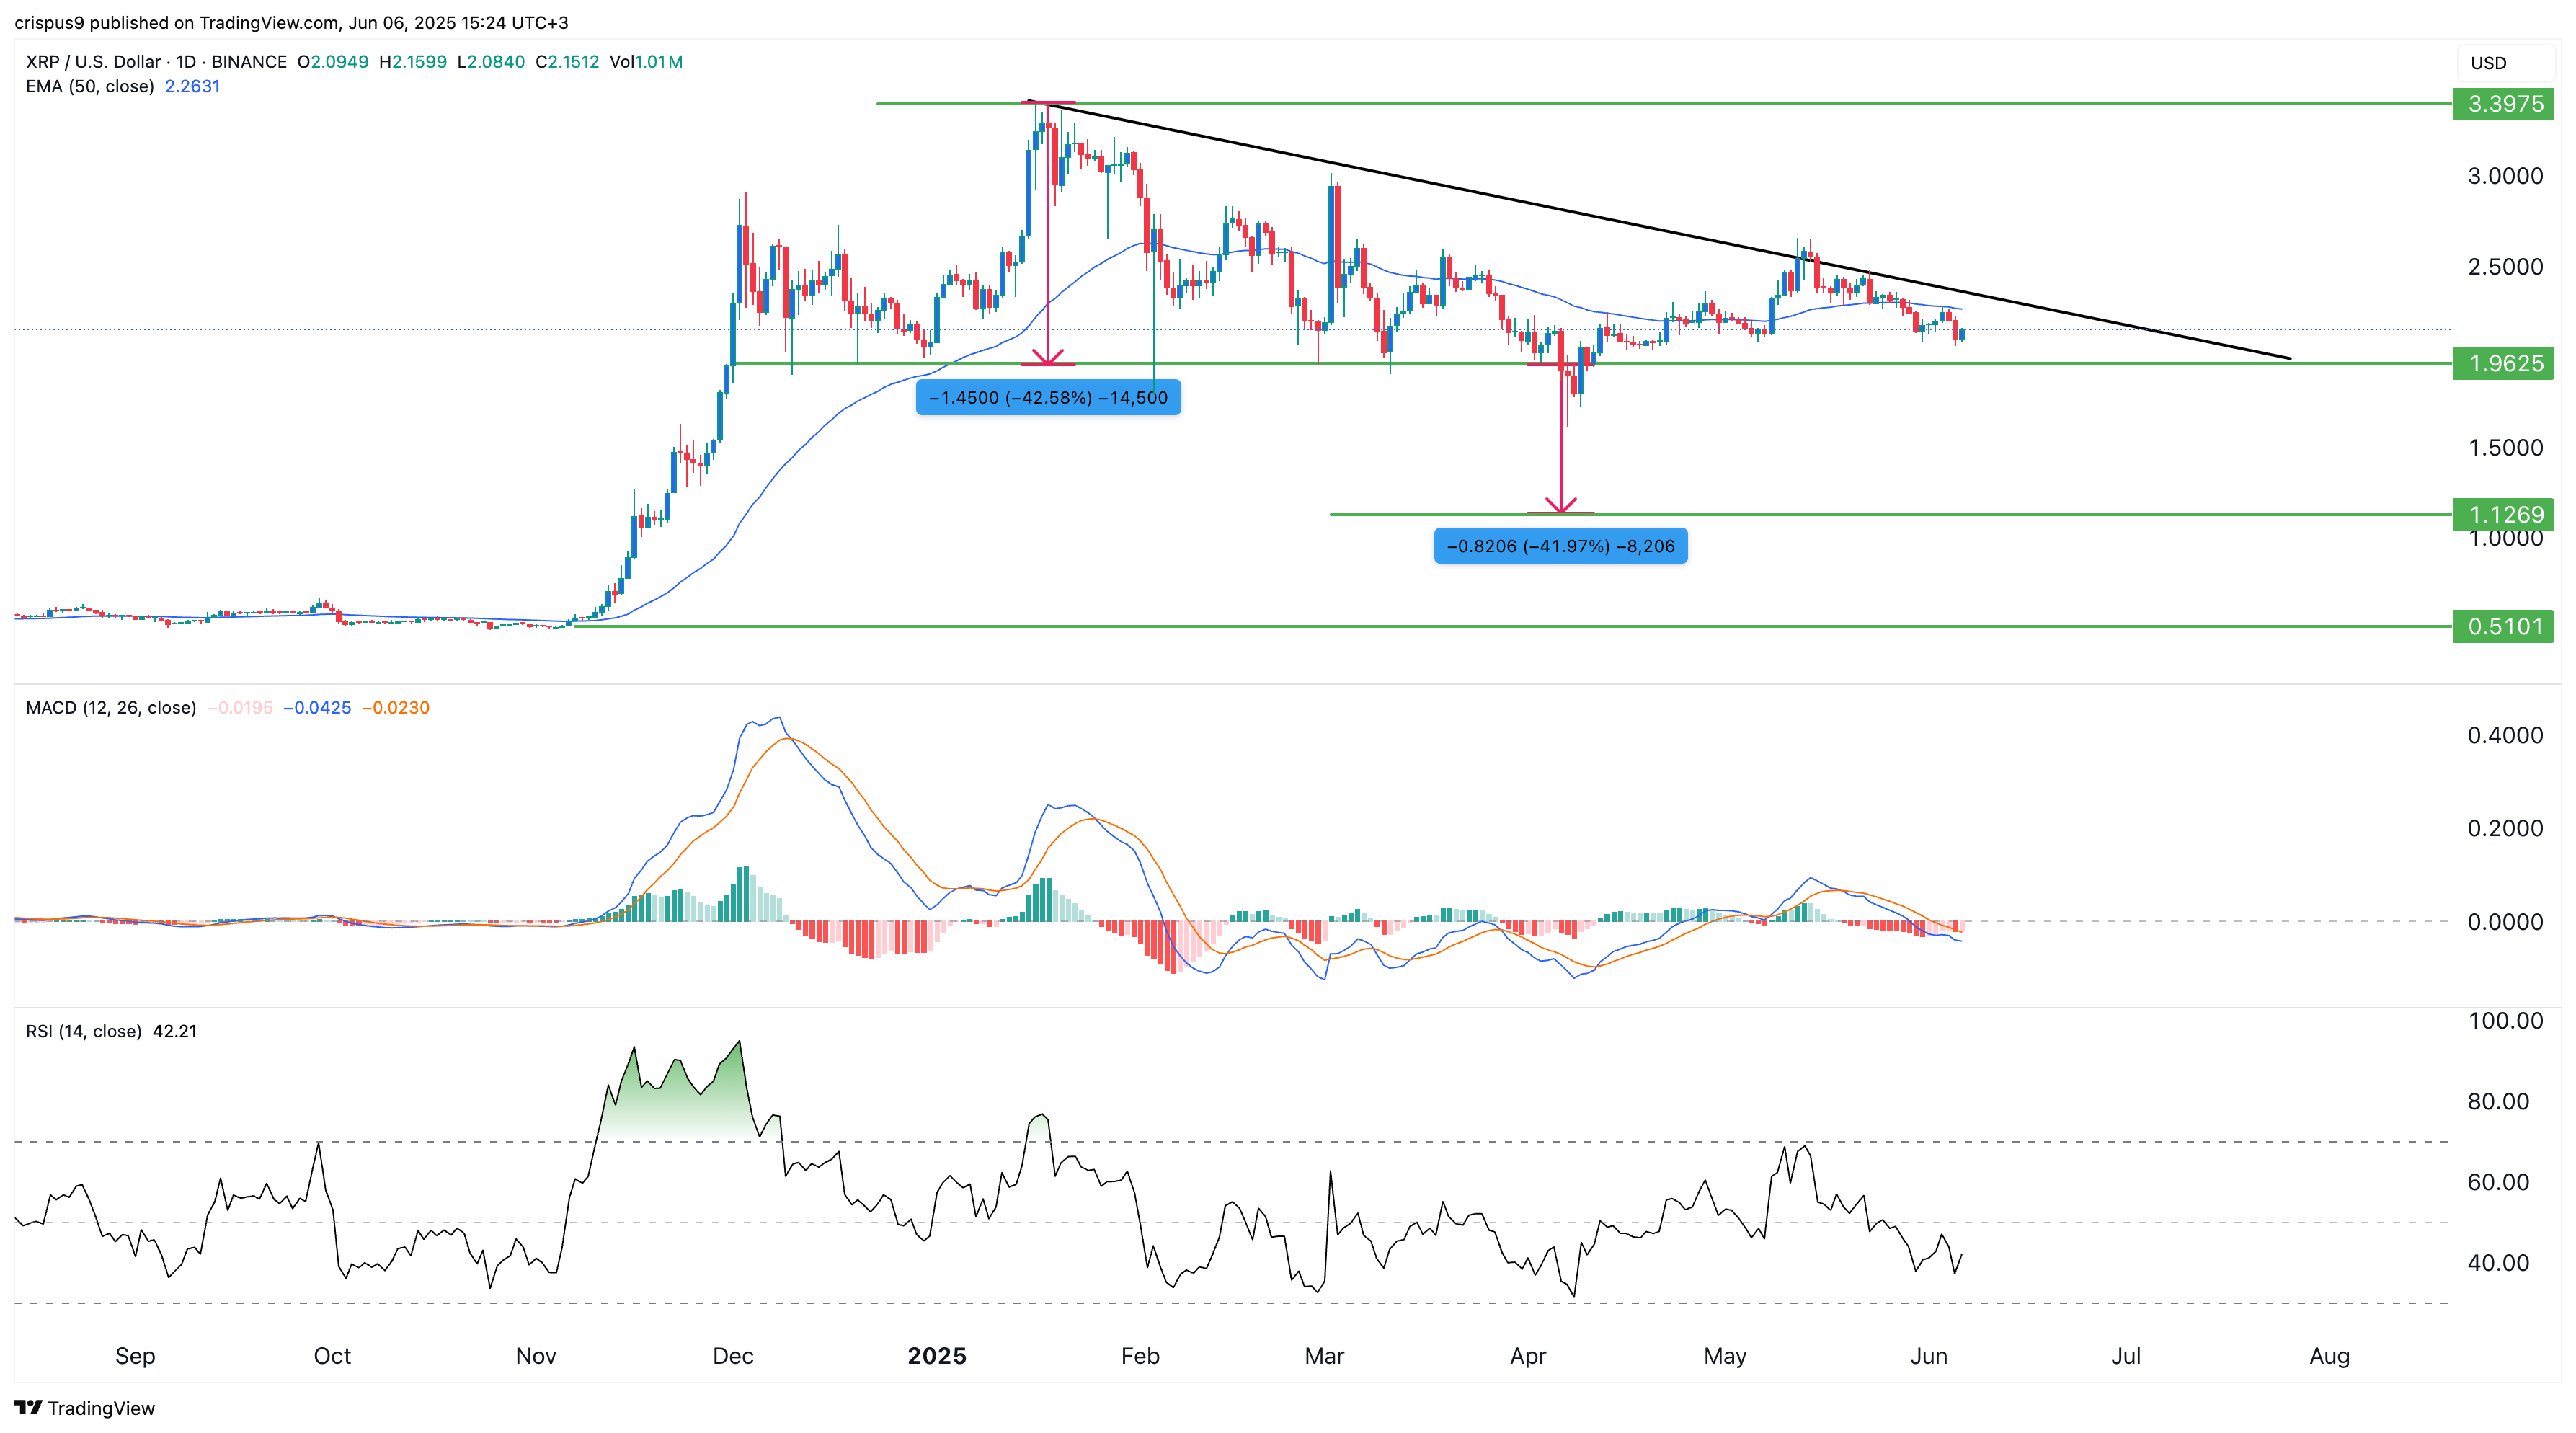
XRP price chart | Source: crypto.news
The daily chart shows that XRP peaked at $3.40 in November following Donald Trump’s election.
It has since dropped 37% to the current $2.15 despite a series of positive developments, including the end of the SEC vs Ripple case, Hidden Road acquisition, and ETF applications.
The coin has fallen below the 50-day Exponential Moving Average, signaling that bears currently have control.
XRP has also formed a descending triangle pattern, defined by a horizontal support level and a descending trendline. The lower boundary of this pattern is at $1.9625, a level that has held firm on multiple occasions since November. The descending trendline connects the swing highs from January 16, March 1, and March 13.
Descending triangles typically precede bearish breakouts. The projected price target, based on the pattern’s height, is a 42% decline from the $1.9625 support, pointing to a possible drop to $1.1270.
You might also like: AAVE price bounces from $240 as whales accumulate, but momentum shows signs of weakness
Read the full article here


